U.S. Department of Transportation
Federal Highway Administration
1200 New Jersey Avenue, SE
Washington, DC 20590
202-366-4000
de la Bruhèze, A. & Veraart, F. (1999). Fietsverkeer in praktijk en beleid in de 20e eeuw. Timeco. Minsterie van Verkeer & Waterstaat. In Dutch.
CROW (2007). Design Manual for Bicycle Traffic.
Jordan, P. (2013). In the City of Bikes: The Story of the Amsterdam Cyclist. Harper Collins (ed). The Netherlands.
Oldenziel, R., Emanuel, M., de la Bruhèze, A. & Veraat, F. (2016). Cycling Cities: The European Experience. Eindhoven University of Technology (Eds.).
Oldenziel, R., & Albert de la Bruhèze, A. (2011). Contested Spaces: Bicycle Lanes in Urban Europe, 1900–1995. Transfers, 1(2), 29–49. https://www.berghahnjournals.com/view/journals/transfers/1/2/trans010203.xml
Ploeger, J. (1990), "Rol fiets systematisch ondergewaardeerd", in: Vogelvrije Fietser,
1990, no. 3: 10-11. Veraart, F.CA. (1995), Geschiedenis van de fiets in
Nederland, 1870-1940, Eindhoven: Technische
Pucher & Buehler (2012). Cycling city. MIT Press.
Schepers et al. (2013) Road safety and bicycle usage impacts of unbundling vehicular
and cycle traffic in Dutch urban networks.
SWOV (2012). Background of the five sustainable safety principles.
SWOV (2013). Sustainable Safety: principles, misconceptions, and relations with other visions
Bicycle Master Plan promotion video:
https://www.youtube.com/watch?v=QExnRr9VAJw
RAI (2016). Branche-analyse Fietsen.
https://raivereniging.nl/artikel/marktinformatie/branche-analyses/brancheanalyse-fietsen.html
Wagenbuur, M. (2011). How the Dutch got their cycle paths:
https://www.youtube.com/watch?v=XuBdf9jYj7o
Wagenbuur, M. & Furth, G. (2017). Systematic Safety:
https://www.youtube.com/watch?v=5aNtsWvNYKE
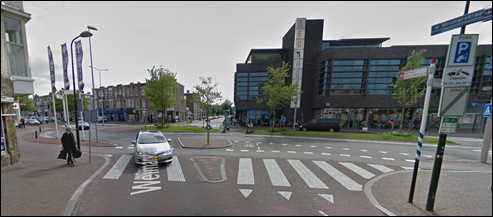
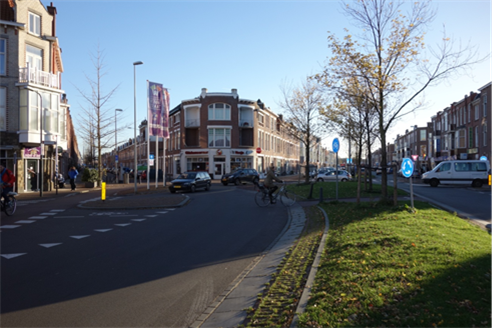
Sustainable Safety has important implications for road design. It divides all urban roads into two road categories: access roads[62] with a 18 mph speed limit and distributor roads[63] with a 30 mph (main roads) or 45 mph (through traffic roads) speed limit. Based on these principles and these road classification, the Netherlands implemented three main types of cycling infrastructure. Segregated cycle tracks are to be used for roads on distributor roads when the speed exceeds 30 mph and 2x2 lanes are present. At the other extreme, shared space, combined with speed bumps and other design measures to lower car traffic, is preferred on access roads with speeds below 18 mph. Moreover, depending on the volume of car traffic and bicycles, bicycle streets[64] or cycle lanes with right of way are implemented. On bicycle street CROW recommends that the ratio between cycling and motor traffic should be 1 car to 2 people cycling, or preferably 1 motor vehicle to 4 bicycles. Moreover, the cycle street should have priority over all side roads and should be placed in an area that is frequently used by cyclists. The asphalt used should be smooth to enhance comfort. At speeds between 18 mph and 30 mph and depending on the volume of cycling and motor vehicles, designers may opt for bicycle lanes (on 2x1 streets) or tracks. Outside urban areas, cycle lanes and shared space or cycle lanes on 40 mph roads are allowed only when the number of motor vehicles is lower than < 500/day. At higher speeds and higher volumes, segregated cycle tracks along the road are preferred. The table below summarises the main segregation principles.
Bicycle network |
||||||
|---|---|---|---|---|---|---|
Function |
Max. speed of motorized traffic (mph) |
Motorized traffic intensity (pcu[65]/day) |
Basic network (Ibicycle > 750/day) |
Cycle route (Ibicycle500-2500/day) |
Main cycle route (Ibicycle>2000/day) |
|
n/a |
0 |
Solitary track |
||||
Access roads |
Walking pace or 18 mph |
1 – 2.500 |
Shared use |
Cycle street or cycle lane (with right of way) |
||
2.000 – 5.000 |
||||||
> 4.000 |
Cycle lane or cycle track |
|||||
Distributor roads |
30 mph |
2x1 lanes |
Irrelevant |
Cycle lane or cycle track |
Cycle track or parallel to road |
|
2x2 lanes |
Cycle track or parallel to road |
|||||
45 mph |
Cycle track, moped/cycle track or parallel to road |
|||||
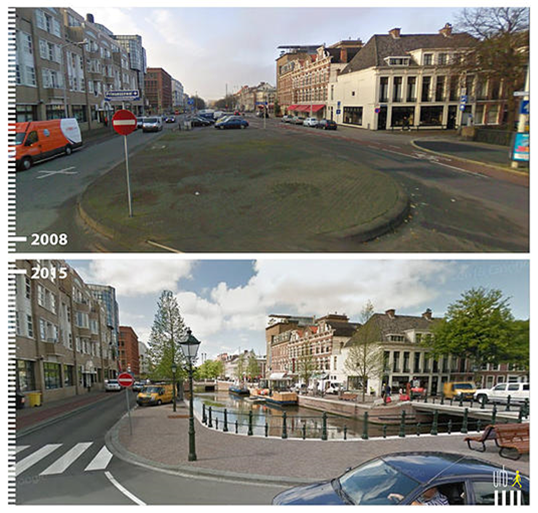
Source: Google street view
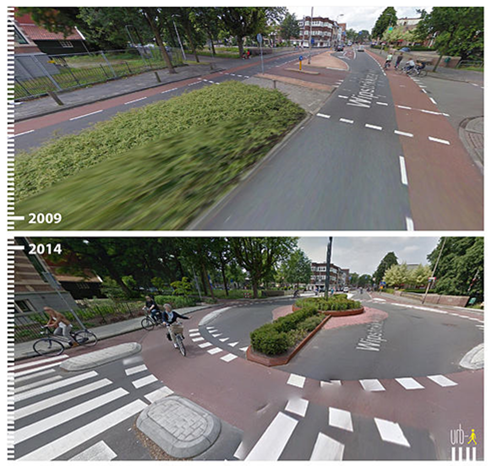
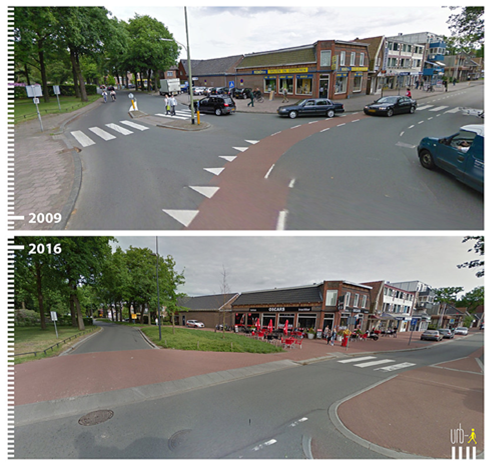
Source: Google street view
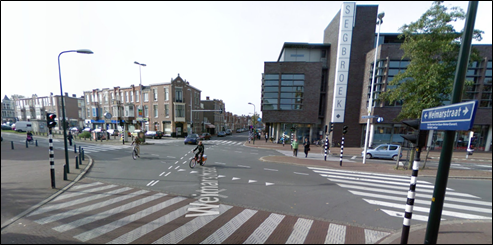
Source: Jeroen Buis
[1] Fishman et al. (2016) Dutch Cycling: Quantifying the Health and Related Economic Benefits
[2] Evidence shows that bicycles do not compete with public transport, but they represent its feeder system.
[3] See a literature review of socio, economic and environmental benefits of cycling here: de Hartog et al., 2010; Oja et al., 2011; Pucher & Buehler, 2012; Martens, 2013 and the EU-funded Evidence Projects (2015) www.evidence-project.eu, that brings together a systematic peer reviewed body of high quality research on sustainable transport, including cycling.
[4] RAI (2016)
[5] Pucher & Buehler (2012)
[6] KiM (2016) http://web.minienm.nl/mob2016/
[7] The topic has been treated by de la Bruhèze & Veraart (1999); Oldenziel & de la Bruhèze (2011); Jordan (2013); Oldenziel et al. (2016) more extensively.
[8] CROW (2007)
[9] Ploeger (1990)
[10] As cited by Oldenziel & de la Bruhèze (2011)
[11] Jordan (2013)
[12] Gemeente Amsterdam, Het Verkeer te Amsterdam volgens de uitkomsten van de openbare verkeerstelling 1930 (Amsterdam: Dienst Publieke Werken, 1934)
[13] Dollars are calculated to the value of the year the money was spend. So in this case 8 to 15 billion dollars between 1972 and 2000.
[14] Topics studied included changes in mode choice, route choice and the use of the cycle network. As well as origin- and destination patterns, road safety and specific studies on effect of expensive infrastructure measures such as bridges.
[15] CROW (2007)
[16] Martens (2007)
[17] Ministry of Transport and Water management (1999), p.50 - 51.
[18] CROW (2009); Pucher& Buehler (2012); CROW (2015); Schepers et al. (2017).
[19] SWOV (2017)
[20] OViN (2015); CBS (2015)
[21] KiM (2016)
[22] Decisio (2012). Social costs and benefits of investing in cycling.
[23] Decisio (2016). Bruto Utrechts Fietsproduct (Gross cycling domestic product of Utrecht).
[24] Utrecht University (2015): https://www.uu.nl/en/news/dutch-bikers-live-six-months-longer
[25] Waze Driver Satisfaction Index: https://www.waze.com/driverindex
[26] Van Goeverden & de Boers (2008)
[27] This data is not converted to dollars, because it is just meant to show a comparison between countries.
[28] Ruffino (2016)
[29] This is a Dutch classification used by the knowledge centre CROW Fietsberaad. In the US context, a similar classification is used called 4 E’s (Engineering, Education, Enforcement, Ecouragement).
[30] National knowledge center on transportation (described in paragraph 3.3.1).
[31] CROW (2007)
[32] Mark Wagenbuur (2017) in his blog bicycledutch.wordpress.com takes an in-depth look at Sustainable Safety and its implications on road design. See references.
[33] As defined by Schepers et al. (2013)
[34] See Schepers (2013). Road safety and bicycle usage impacts of unbundling vehicular and cycle traffic in Dutch urban networks
[35] In the presence of high bicycle traffic, car drivers tend to adjust their behaviour (lowering their speed and driving more carefully) to avoid collision and thus increasing safety.
[36] An interactive map can be found here: https://maps.amsterdam.nl/?LANG=nl
[37] Harms et al. (2015)
[38] Stauton, Hubsmith & Kallins (2003)
[39] Pucher & Buehler (2012)
[40] By selecting a route on the map, the heat map highlights the most common origins and destinations of cyclists in that specific map.
[41] Single-bicycle crashes refers to those accidents that involve only the cyclist him- or herself. For example, when the rider loses their lane position, collide with obstacles etc.
[42] Ormel et al. (2008). Enkelvoudige fietsongevallen [Single-bicycle crashes]. Amsterdam: Stichting Consument en Veiligheid.
[43] Schepers & den Brinker (2011). What do cyclists need to see to avoid single-bicycle crashes.
[44] During this research, we discovered that it was hard to find documentation, images and policy documents to support the cases. We interviewed experts for additional information and took pictures ourselves. That is why not every not every case is build up in the same order and with the same type of information.
[45] Data collection for pedestrians started in the ‘70s. Before this, pedestrians were mainly included in the share of cyclists.
[46] This measurements are similare to the Advisory Shoulders. These lanes create usable shoulders for bicyclists on a roadway that is otherwise too narrow to accommodate one. Motorists may only enter the shoulder when no bicyclists are present and must overtake these users with caution due to potential oncoming traffic (FHWA, 2016. Small town and rural multimodal networks)
[47] Source: Wagenbuur (2016)
[48] This video shows the situation before and after retrofitting: https://www.youtube.com/watch?v=Ibcly3iLpS8
[49] Cycling cities (2016)
[50] List of busy roads and intersections in the country
[51] Stadsregio Amsterdam, 2010
[52] Stadsregio Amsterdam, 2010; Gemeente Haarlemmermeer, 2015.
[53] De Meerlanden, 2008; Gemeente Haarlemmermeer, 2015a).
[54] Stadsregio Amsterdam, 2010; SOAB, 2013
[55] SOAB 2010; SOAB 2013
[56] Stadsregio Amsterdam, 2010; Gemeente Haarlemmermeer, 2015; Gemeente Haarlemmermeer, 2015b
[57] Public Transport and cycling must pick the striker a market share of 70% together in dense urban areas, 50% in the large nuclei and 30% in small towns.
[58] Gemeente Haarlemmermeer, 2015
[59] Interview with local cyclists’ union
[60] Local bus transport and cycling do prove to be competitors in the Netherlands as the introduction of a free public transport pass for students showed.
[61] This Dutch model is the idea of solving problems via consensus decision-making and dialogue, with every party having an equal say. Mostly parties with different interest like employers, (labor) unions and government.
[62] 'Erftoegangsweg' in Dutch.
[63] 'Gebiedsontsluitingsweg' in Dutch. On the urban scale 30 mph Gebiedsontsluitings roads are typical Collector or Distributor Roads and 45 mph Gebiedsontontsluitings roads can be considered urban Arterial roads.
[64] “Fietstraat” in Dutch.
[65] Passenger Car Units

