U.S. Department of Transportation
Federal Highway Administration
1200 New Jersey Avenue, SE
Washington, DC 20590
202-366-4000
This chapter highlights four cases to demonstrate retrofitting examples in the Netherlands in practice. The cases are selected because they are comparable to situations in the U.S. The urban cases in Utrecht and Amsterdam show retrofitting at locations in wide streets or large junctions. Next, two sub-urban cases are selected to show the retrofitting in the sub-urban context[44].
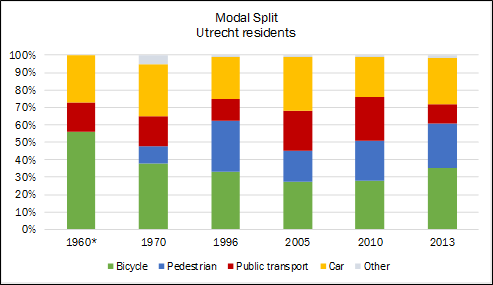
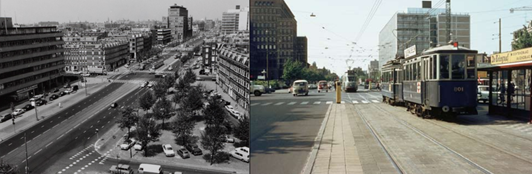
In Utrecht, cycling policies changed in the early 1990s. Sustained lobbying by the Cyclists’ Union moved parliament to provide subsidies. The city improved existing cycling routes by creating segregated cycle tracks, cycle lanes and bicycle parking facilities. After 1995, radical measures to limit on-street car parking created more space for cyclists. The authorities banned car parking at the central square and blocked through-traffic. This was successful: car use decreased with around 30 percent and cycling increased with around 30 percent.
Source: Oldenziel, R. et al. (2016). Cycling cities[45]
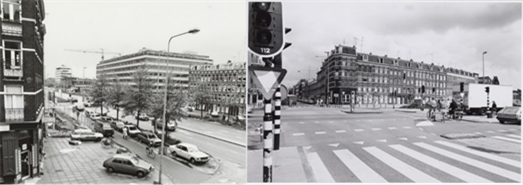
More and more people used bicycles for multimodal bicycle-train-bicycle trips. Cycling policy turned out to be an ongoing process of negotiation. The initiative of a dedicated ‘’bicycle street’ and a cycle path through the park sparked heated debates. It was only after 2011 that a new coalition brought more changes and bigger innovations in cycling infrastructure. Today Utrecht boosts 150 miles of cycle paths, 55 miles of cycle lanes and numerous bicycle parking garages in the city center, especially around the central train station.
Utrecht before / after
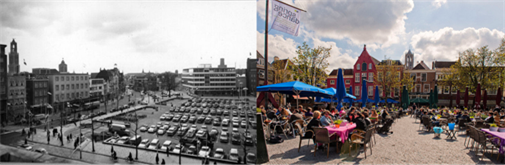
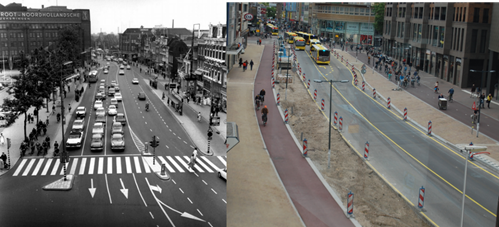
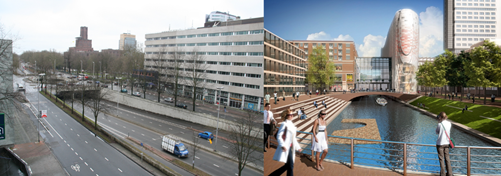
Source: Archive Utrecht, Bicycle Dutch, CU2030
The two cases that are presented here for Utrecht show retrofitting in different situations. The first case illustrates changes made in a residential area that was mainly designed around cars in the 1960s and it has been recently ‘retrofitted’ to an area with improved road safety and livability. The second case shows a recently redesigned junction where an innovative street designed has been tested.
The situation
Overvecht is a neighborhood developed in the 50s and the 60s as result of the expansion of the city. This was initially designed around car use: the streets present a wide layout, on street parking and easy access to the motorway. However, the area mainly had residential functions, so the focus on motor traffic did not suit the use of the area. The street grid in this neighborhood is recently updated to the 21st century Dutch standards to make the area safer, more attractive and more livable for its residents. This is mainly done by concentrating motorized traffic flows on Distributor roads and changing the remaining areas into 18 mph zones (Access roads).
Design
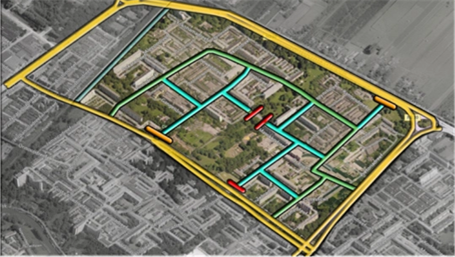
In the original 1960s grid design, motor traffic could use all streets to cross the neighborhood. Most streets were residential, but all streets had the same speed limit of 30 mph. To better channel traffic flow a ‘neighborhood’ ring was designated and the function of distributor road (gebiedsontsluitingsweg) was assigned. This ring is depicted with the green line in figure 17. The light blue streets in the figure changed from main streets to Access streets with a speed limit of 18 mph. At some places through car-traffic was blocked to force car traffic in a specific direction and allow only cyclists and pedestrians to pass. These principles are an application of the Sustainable Safety principles and policy as explained in the previous chapter.
Source: Wagenbuur (2013)
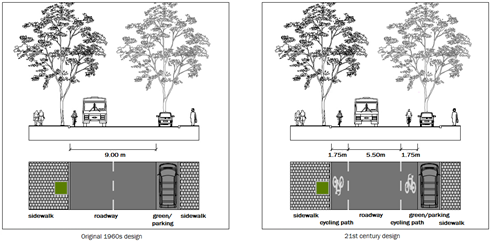
Besides differentiation between the neighborhood ring and access/residential streets, the road design was also changed to improve safety. On the neighborhood ring the center line was removed and bicycle lanes were added (Figure 37)[46]. In this case, the municipality chose for cycle lanes instead of separated cycle tracks for the ring road. This was done because the ring is not for through traffic and the speed limit is 30 mph (see Appendix 2 for technical details).
Source: Wagenbuur (2013)
The process
At the time when the plans for retrofitting were presented not all residents were in favor. They feared that forcing car drivers to use the neighborhood ring would lead to longer routes and more emissions.
The effects
The new road design provides cyclists in the area with more safety and comfort. Follow up research conducted by the municipality showed that traffic diversion did not lead to increased congestion and environmental problems, rather traffic safety and livability has improved as traffic is pushed out of the residential neighborhood. Car drivers are now used to the new road design and lower their speed. One of the goals of the municipality was an increasing number of residents from the area to travel by bicycle, but this effect has not been measured yet. The bicycle facilities in the area are more often used by through traffic (by foot or bicycle) then before. These travelers do think the new road design has a positive effect on their bicycle “experience”.
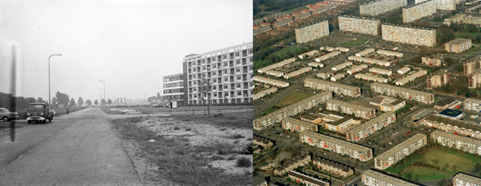
Retrofitting in Utrecht Overvecht Figure 39 – 40 Before & after the intervention |
|
 |
|
| 1966 | 1994 |
 |
|
| 2013 | 2016 (new design) |
Source: Het Utrechtse Archief
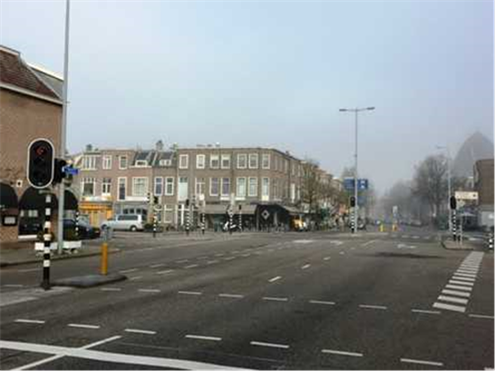
The situation
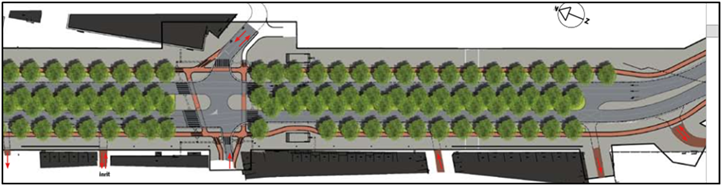
Recently, in Utrecht, a complicated five-arm junction has been reconstructed. The junction was originally designed to suit the needs of the car. Multiple car lanes and traffic lights were needed to organize traffic going in the five different directions. There are many shops, schools and a large hospital located around the junction, so the design did not suit the public use of the area. Therefore, this has now been reconstructed for ‘people’. Cyclists and pedestrians have gotten more space and cars have to behave as ‘guests’ at the intersection. Meaning that the urban space is no longer designed for the car, but every location can still be reached with one[47].
Source: Wagenbuur (2016)
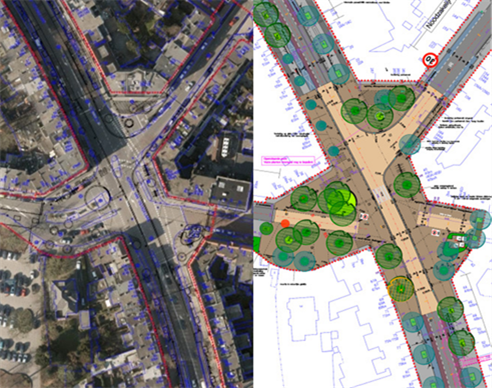
The design
Many elements have changed at the junction. The key change is that rather than having traffic from five different directions coming together in one single intersection, now the intersection is split in T-junction and one main road with two side roads. This is according to Sustainable Safety principles, it makes the intersection simpler and reduces complexity. Traffic signals have been removed, the maximum speed has been reduced from 30 mph to 18 mph and the roads have been narrowed. Nevertheless, the width is still enough to allow a smooth traffic. It is now easier for pedestrians to cross the streets as sidewalks have been widened and bus stops can be reached easily and safely. Dedicated crossings have also been improved for cyclists.
The process
Implications were discussed in the planning phase. The changes at the intersection were designed by the city in close cooperation with residents and entrepreneurs in the area. In particular, two main concerns were raised by participants with regard to motor traffic volumes. First of all, they feared that by removing traffic lights, reducing speed limits and downsizing the intersections would have led to increased congestion. Secondly, it was believed that mixing traffic and eliminating physical separation between cyclists and motor traffic would lead to safety issues. The city simulated different scenario showing that the design was feasible. Requests by stakeholders for zebra crossings, speed humps and more traffic signs informing about the speed limit were mostly dismissed, because they would go against the nature of a 18 mph zone.
Source: City of Utrecht (2016); Wagenbuur (2016)
An important stakeholder group in this reconstruction were the entrepreneurs. The owners of shops and restaurants in the area were in favor of the design and thought that it would contribute to the economic vitality of existing businesses.
The effects
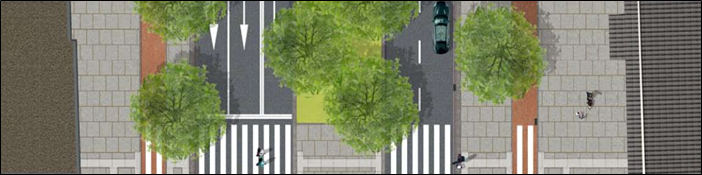
Now that the junction has been recently reopened after reconstruction a totally new atmosphere can be experienced in the area. The design of the junction makes cyclists - and especially pedestrians - feel safe. Still, there were some challenges worth mentioning. The junction was always designed for motorists, so after the reopening of the junction motorists had to get used to the new situation and speed levels. Like the municipality and the designers expected users got used to the junction fast and the situation has improved to a more quiet, safe and welcome area[48]. Residents and entrepreneurs are satisfied with the changes made and pedestrians as well as cyclists feel more safe.
Retrofitting of Adrian van Ostadelaan – current profile (2016)
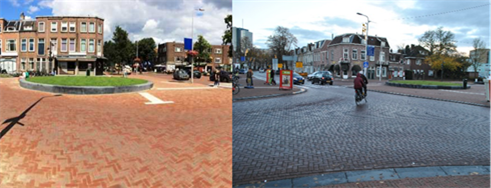
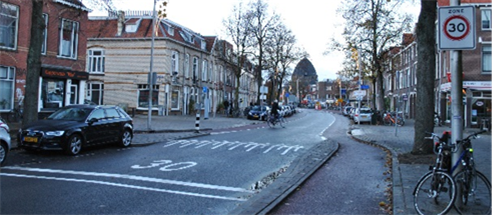
Source: Wagenbuur (2016); Paolo Ruffino (2016)
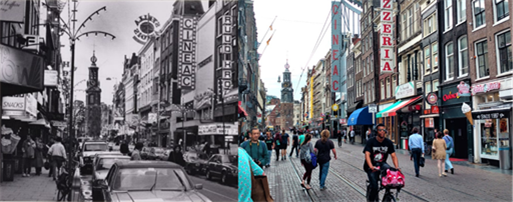
It was only around the 1990s that cycling reversed its decline and began to expand at a startling pace. Reducing car use by cutting back on car parking was one of the tactics. In a fifteen-year period (1990 – 2006) traffic counts in the historic center showed a drop-in car trips (235.000 to 172.000) and a 40 percent increase in the number of cycling trips per day (340.000 to 490.000).
Source: Oldenziel, R. (2016)
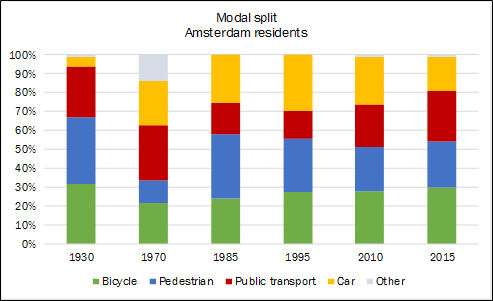
The share of cycling in the modal split in the metropolitan area of Amsterdam was 32 percent in 2014. However, in the city center the modal split was 87 percent (for trips shorter than 2 miles).
Source: Beeldbank Amsterdam; Paolo Ruffino (2017)
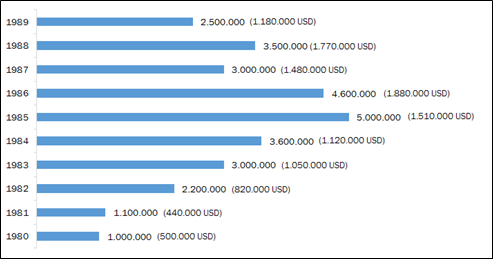
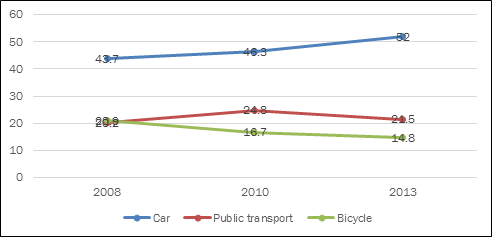
The cycling network that was created in 1978 (Hoofdnet Fiets) still counts as a guide for policymakers. Now the ‘bicycle team’ in the city is working on an improved network to make cycling in the city even more convenient and safe. The city appointed a bicycle coordinator to align neighborhoods’ policies with the policy of the central city. In 2002 the budget for bicycle infrastructure was increased from 5 to 70 million Euros[49] (5 to 75 million USD) per year and the goal was set to achieve a cycling share of 37 percent in 2010. The new city council realized cycling could not grow in a safe manner by itself: measurements are needed. The graph shows that modal split between the different transport modes is well balanced in Amsterdam.
The situation
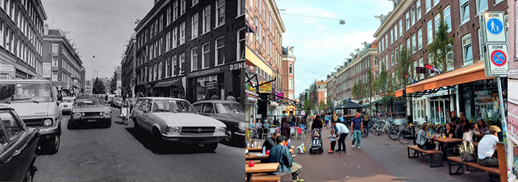
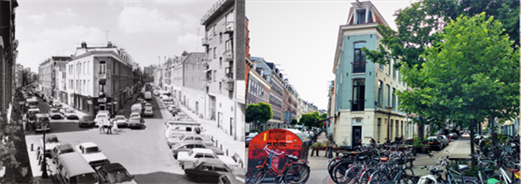
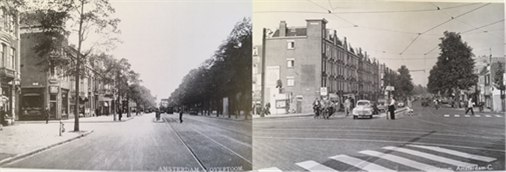
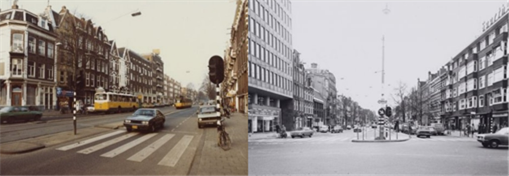
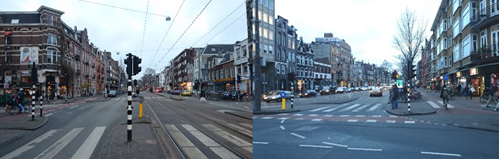
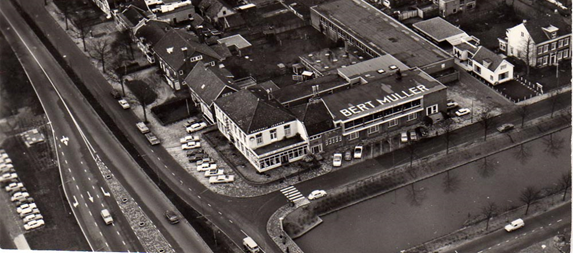
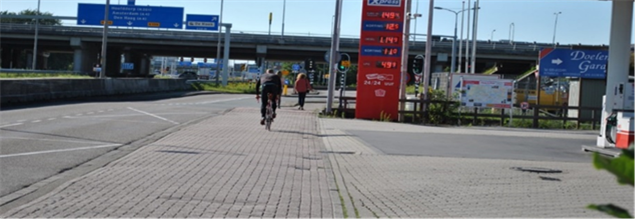
The Overtoom is a busy street in the center of the city. This street had been retrofitted for cyclists many years ago. No specific documentation about this retrofitting can be found, but the pictures below show that the transformation fits the original cycling policy of the 90s. Issues that discouraged citizens from using their bicycles were safety, exhaust fumes, theft, the weather, and distances.
The design
The basic principles of the cycling policy in the 90s were:
The new cycling infrastructure was attached to the ‘Duurzaam Veilig’ principles (see Chapter 3.).
The process
When new councilors were appointed in 1978, serious attention was given to cycling policy. In this period, a cycling workgroup was set up to draft cycling policies and research the main bottlenecks in the city. The Cyclists' Union was also a member of this workgroup and operated as an advisory body. A specific budget was appointed for cycling infrastructure and other matters like parking facilities and the promotion of cycling. In ten years a total amount of 30 million Guilders (13,8 million dollars) was spend on bicycle policy. This separate ‘bicycle budget’ appeared to be an effective tool for cycling policy. Other funds for bicycle policy came from major maintenance projects in the municipality, the ‘city renovation fund’ and subsidies from the province or the central government.
Source: Cycling cities (2016)
When improving and creating cycling routes, a distinction was made between the main and secondary network. Citizens as well as some councilors opposed this idea claiming that the entire cycling network should be optimal for cyclists. But this distinction made clear which routes were the most important ones and should get priority. This was also part of the so called ‘bottleneck approach’. The worst and most dangerous bottlenecks were taken care of first. This ensured the transformations to be visible in the entire city. Often the changes in the cycling network were combined with general infrastructure maintenance works to lower the costs.
The effects
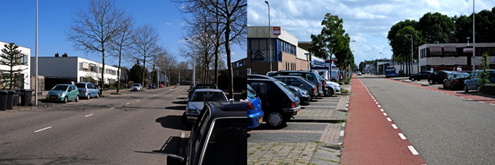
The Overtoom transformed from a car oriented street to a street that is safe for pedestrians and cyclists. Segregated cycle tracks for cyclists and additional traffic lights are exemplary implementations to ensure this effects.
Source: Beeldbank Amsterdam: Wagenbuur (2012): Decisio (2016)
The situation
The Wibautstraat is an important thoroughfare which connects two main ‘entrances’ to the city. Over the last couple of years the street has transformed from a mono-functional road to a multifunctional area. Several organizations and companies are now established on the street, from profit to non-profit, cultural institutions, colleges, restaurants, shops, a hospital and a lawyer's office. At the same time, little has changed to the spatial layout and the quality of the area. This does not fit the new functions and diversity anymore.
The design
The new design aimed/aims to make Wibautstraat a lively, pleasant and safe open space for residents and other users. Measures will be implemented in a way that the street can still serve as a thoroughfare for cars and public transport. The most important changes are:
When making all these changes 106 car parking places will be removed, but they will be compensated in a new parking facility.
Source: City of Amsterdam (2009)
Source: City of Amsterdam (2009)
Source: City of Amsterdam (2009)
The process
From 1998 until 2001 a new design was created for the street in close cooperation with residents and other users of the area. The Wibautstraat project is divided into several subprojects. Besides redesigning the street and its layout, other buildings and functions along the street are improved. For example a big metro station and squares along the street. The project group ‘Wibaut aan de Amstel’ was set up to coordinate the different components of the project for coherence and alignment. The project group made sure that change in public transport schedules did not cause for too much nuisance for example. The project group is also in close contact with the planners in the central city to make sure the plans at the Wibautstraat connect to infrastructure planning in the rest of the city.
The effects
Since the first changes were made in 2010, much of the original design elements have changed in the Wibautstraat (see Figures 57 to 62). Besides the existing functions, new restaurants, coffee bars, two hotels and other young companies settled in the street. The transformation is not yet completed, but this will be done in the coming years.
Source: Beeldbank Amsterdam, Paolo Ruffino (2016) and Decisio (2016)
Hoofddorp is the main town of the Haarlemmermeer municipality in the province of North Holland in the Netherlands. In 2009, the population was just over 73,000. The town was founded in 1853, immediately after the Haarlemmermeer had been drained. Located in the south of Amsterdam, the city mainly has a sub-urban residential function with low density. The cycle track addressed is located in the metropolitan area of Amsterdam between the cities of Hoofddorp and Aalsmeer. Although the fast cycle route is still in realization it illustrates what reasons may motivate such intervention.
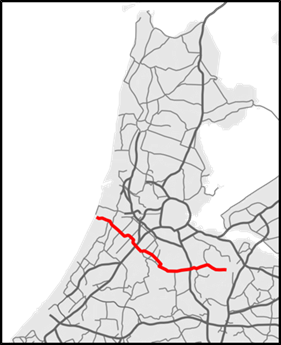
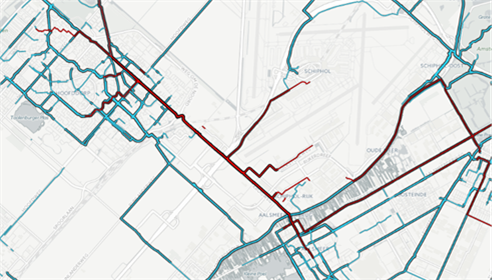
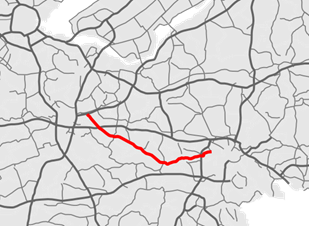
Figure 67 Depiction of the route
The situation
The N201 Kruisweg is an important provincial road that connects Zandvoort to Hilversum and intersects with the A4 between Hoofddorp, Aalsmeer and the Schiphol Airport. Although this is not specifically listed in the “congestion top 50”[50], annual travel time and traffic measurements indicate it has one of the busiest road sections of the country (ibid.).
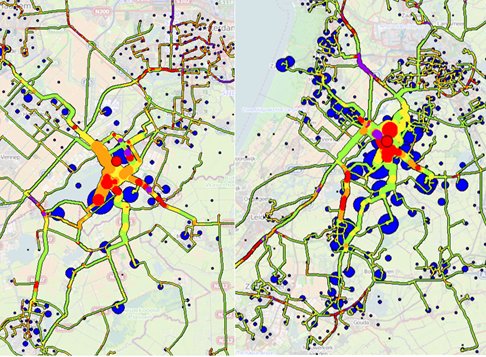
Between Hoofddorp, Schiphol and Aalsmeer, important economic activities are located which attract traffic from the surrounding municipalities causing bottlenecks during morning and evening rush hour. Part of this congestion is caused by short trips taking place during morning and evening rush hour due to traffic arriving to and/or departing from Schiphol Airport and its surrounding area (ibid.). In addition, the motorized traffic currently cuts through a number of residential and commercial areas, impacting the quality of life, traffic safety and determining slow traffic on other provincial and regional roads[51]. According to a local and regional problem analysis, the level of bicycle use in the area is low due to the poor quality of the infrastructure that may bring substantial “disutility” to cycling and encourage car travel instead[52]. Traffic counts show low levels of bicycle use in relation to the number of people living and working in the area[53]. An early qualitative analysis and a large-scale mobility survey among Schiphol Airport employees, underlined these unattractive conditions as a factor for not cycling[54]. In particular, the comfort, the number of intersections and safety concerns were specifically mentioned. Moreover, between 2010 and 2013, the number of workers commuting to the Schiphol Area by bicycle declined from 3,2% to about 2,6%[55]. Meanwhile, car use has steadily increased to almost 60% of the totality of the trips (ibid.). This is also the case for those workers living in the neighboring municipalities where bicycle use has declined in favor of car use.
Source: Stadsregio Amsterdam (2015)
Source: SOAB (2013)
Hence, by improving the cycling conditions, it is believed that there is the potential to substantially increase bicycle use in the area[56]. In addition, by encouraging a modal shift to cycling it is also believed to be beneficial to tackle traffic congestion in the area (ibid.).
Source: Bike Print (2016)
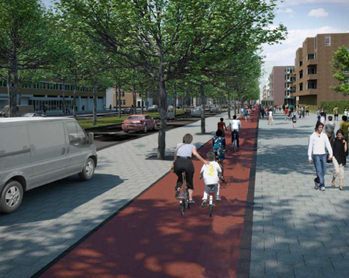
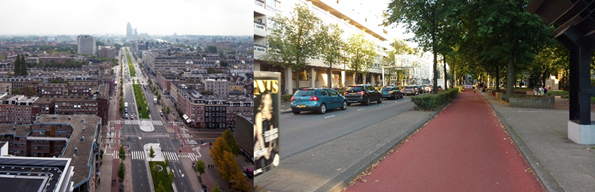
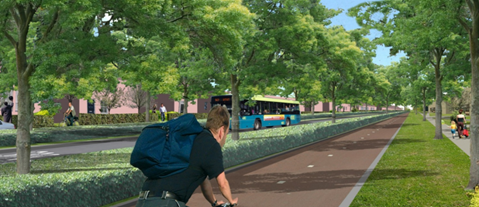
The proposed intervention aims at encouraging a modal shift to cycling by improving the current cycling conditions. In particular, the construction of a high-quality fast cycle route to connect Hoofddorp, Aalsmeer and Uithoorn (circa 4 miles) in order to improve local and regional accessibility to the Schiphol Airport and to other local economic areas by bicycle.
The design
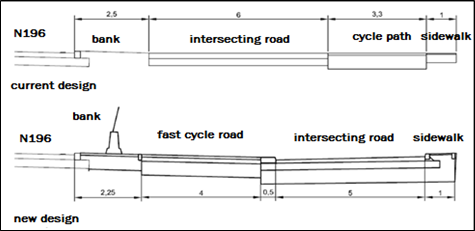
The Kruisweg was an old towpath upgraded to main arterial road for cars, cutting through the city center. After the policy shift in the late 70s, the traffic was rerouted outside of the city center to a ring road (Weg om de Noord) and a bicycle track added to the Kruisweg. However, until now the part connecting Hoofddorp till Aalsmer has hardly been upgraded, except for a few intersections and stretches. The fast cycle route will reuse the old infrastructure, whenever possible, and partially rebuild on the south flank of the Kruisweg to avoid potential conflicts with motorized traffic. The total number of intersections will be reduced from five to two. In addition, the material used will be upgraded to ensure a higher level of comfort. Together with the physical intervention, a behavioral campaign (demand management approach) will be completed in order to encourage people working and living within 9,5 miles to commute to work by bicycle. A special target group of this intervention are the Schiphol employees, which together represent 65000 people. The majority of which commute by car. The total realization cost for the project is €18 million, while the stretch addressed between Hoofddorp and Aalsmeer is of €6 million.
Source: City of Haarlemmermeer (2015)
Source: Paolo Ruffino (2016); Stadsregio Amsterdam (2015); Beeldbank Provincie Noord-Holland
The process
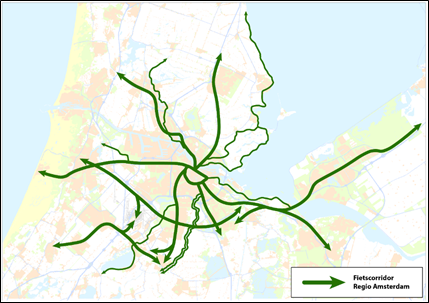
This intervention is embedded within the “Fietscorridor” policy framework of the “Investeringsagenda Fiets” (Bicycle Investment agenda) of the Transport Region of Amsterdam. One of the main goals of the framework is to invest in a high-quality and long-distance regional network of fast cycle routes that connects the municipalities of the City Region and the major transport hubs.
Source: Stadsregio Amsterdam (2015)
The overall ambition is to structurally increase the use of sustainable modes of transport (bicycle combined with public transport) in all types of built environments: low, medium and highly urbanized[57]. To achieve the goal, the approach is to improve the weak links in the network by upgrading them to the latest design standards. To upgrade the bicycle connection to a fast cycle route, the involvement and cooperation of the various authorities (road authorities) are required.
The above parties have established a working group coalition to ask for a grant from the Ministry of Infrastructure. The implementation of the measures is also accompanied by the working group. The Stadsregio Amsterdam acts as the content coordinator on the fast cycle route Hoofddorp-Aalsmeer Schiphol.
The effects
Although the project has not yet been implemented, an assessment was conducted to estimate what would be the economic impact of the project. In particular, it is assumed that the fast cycle route will reduce travel time and increase safety by reducing the number of intersections[58]. Moreover, the current paving slabs on the path will be replaced by smooth red asphalt to increase speed and perceived comfort (ibid). Other benefits identified were attractive roads that increase the propensity to cycle, easier access to jobs located at Schiphol Airport area, tourist attraction and increased physical activity. Finally, by reducing car use, it leads to lower air and noise pollution and the potential for traffic crashes. On the basis of the analysis, a social cost-benefit analysis was performed for this project showing a positive economic balance of about € 2,5 million on average (min -3,5 million, max 8.5 million) after 15 years.
The case addressed is a cycle track along the N225 provincial road between the cities of Rhenen and Elst. The N225 is a former motorway in the provinces of Utrecht and Gelderland. The road links Driebergen and Oosterbeek to Wageningen. The route runs almost parallel to the A12 motorway and the Lower Rhine.
This 29 miles long route was originally the national highway 25 and remained as such between 1932 and 1958. Then the A12 was completed and the N225 was downscaled to provincial road. This also because it crosses several urban centers and villages. In line with the Sustainable Safety policy, the N225 is a distributor road. The speed limit is 50 mph on rural roads and 30 mph along the cities. In Elst (Province of Utrecht), the road was downscaled to an access road with a speed limit of 18 mph.
The situation
The motivation behind the intervention was the safety issues along the N225 between Rhenen and Elst. Between 2001 and 2003, over 30 crashes took place due to lack of visibility and lack of segregated cycling infrastructure. As a result, the province of Utrecht decided to allocate €3 million to reconstruct the road and dedicate a separated bicycle track to increase safety in the area. In addition, adding a bicycle track would have improved local access to Remmerden, an important industrial site in the area.
The design
A two-way segregated cycle path on the northern flank was constructed to ensure safety from fast and intense traffic (40 mph and over 17.000 pcu/day). Because on this road, the volume of cyclists is very low and space is limited at certain locations. A minimum width of only 2.00 m. for the two-way cycle track is applied here while 3.00 to 4.00 m. is used as a standard for busier urban cycle tracks and cycle tracks on fast cycle routes.
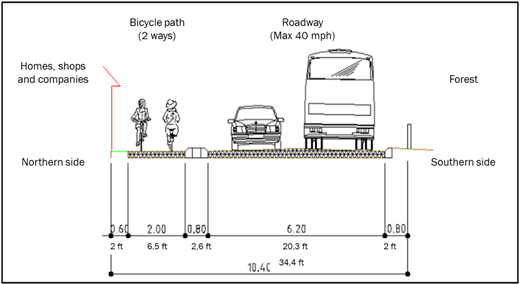
Source: Province of Utrecht (2004) reworked by Decisio
In addition, elevated cycle crossings and a roundabout was added to reduce speeds at intersections and improve visibility.
Figure 76 N225 in 2009 before the intervention
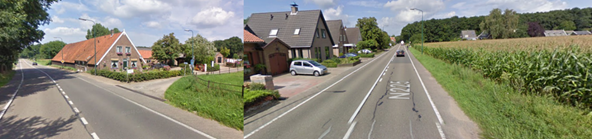
Figure 77 N225 in 2010 during the road works
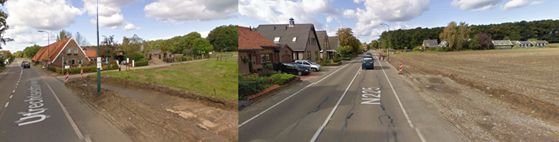
Figure 78 N225 in 2015 after the reconstruction
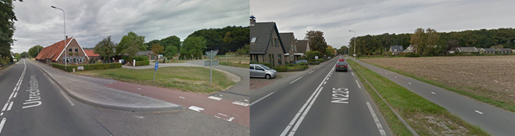
Source: Google Street View
The process
The process started in 2004 and it was implemented in 2009. Several evenings were organized between the municipality, province, local residents and interest groups (cyclists’ union and road safety organizations). The evening events registered a high participation as improving the local cycling conditions was considered by all parties a priority. The sketches of the plan were discussed with all stakeholders and the reactions recorded and assessed. Many attendees, including road safety organizations, raised some objections against the plan as a single path would have crossed several exits, not addressing safety concerns entirely. Two separated bicycle paths, with one way per direction, were preferred by some parties. However, this represented both a technical and financial problem. The higher costs were primarily due to substantial physical barriers (buildings and the Rhine Valley), especially on the southern flank. Hence, it was decided to keep the original plan with one-sided separated bicycle track but with a broader profile and higher separation.
The effects
Although no hard figures are present regarding traffic safety, fewer problems are now reported to the traffic departments of the two small municipalities and the overall impression is that traffic safety has been greatly increased. People cycling in the area declare to feel safer and much more motivated to use their bicycles for their daily commute[59].

