U.S. Department of Transportation
Federal Highway Administration
1200 New Jersey Avenue, SE
Washington, DC 20590
202-366-4000
Several scholars have categorized the historical transport policy transition in the Netherlands (and in other European countries) in four main phases[7]. An early era between the 1860s and the 1920s in which the bicycle was introduced, followed by the explosion of cycling between the 1920s and the early 1950s. The decline of cycling as result of mass mobilization between the late 1950s and mid-1970s. Finally, the contemporary era, from 1975 until today when cycling started rising again and became a symbol of urban sustainability. These periods have been characterized by several institutional, social, economic and political transformations at different levels that have shaped the trajectory of development of cycling culture in the Dutch context. In this chapter, these are briefly outlined and the approach and the role of different actors are highlighted.
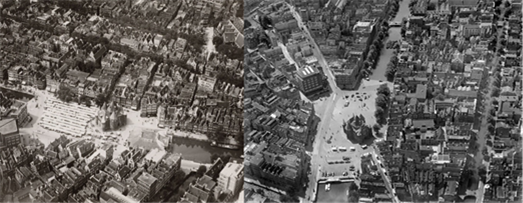
In the late nineteenth century, cycling was not an everyday transportation practice but rather one of the many leisure activities of the Dutch élites. By the beginning of the twentieth century, the bicycle started to become the mode of transport of a wider group of individuals, including professionals, public officials, and specialized workers.
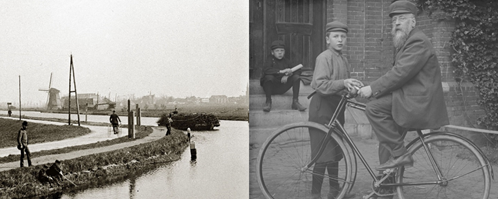
Source: Beeldbank Amsterdam
Bicycle associations and clubs, such as RAI (Rijwiel- en Automobiel Industrie) and ANWB (Algemene Nederlandsche Wielrijders-Bond), were formed and began to lobby for more open streets and towpaths in which cyclists could also ride. The main technical problem at the time was the pavement. It was not a coincidence that during this period, Dunlop developed in this period the first pneumatic tires for bicycles. Cycle tracks (also known as Separated Bike Lanes and Protected Bike Lanes in the U.S.) often were the result of private initiatives and they were designed to improve the cyclists’ comfort[8].
The first intervention by the Dutch government on cycling was in 1899 when a luxury tax was introduced. Although this was highly contested, the revenue represented the first financial contribution to improve local roads and construct dedicated bicycle facilities. This tax was finally removed in 1919 when the retail price of bicycles dropped dramatically and it could not be claimed that the bicycle was a luxury good anymore. By 1920, the bicycle became a model accessible to everyone and it was used as a “workhorse” rather than a “fancy” object.
| Government | Planners | Bicycle organizations |
|---|---|---|
| Top-down taxation to finance early cycling infrastructure | Town and road infrastructure planning performed jointly by government officials and cycling organizations | Advocated for better road surface in cities and towpaths in the country side. Provided expertise to planning and government institutions |
During the post-Great War era, bicycle use began to boom becoming a real mass-scale urban phenomenon. By mid-1934, the Netherlands had over three million bicycles, every second citizen owned one.
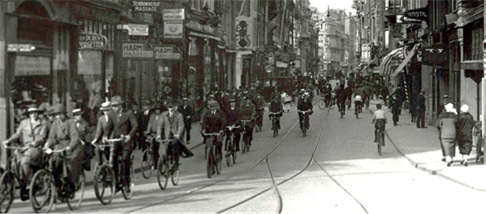
Source: Beeldbank Amsterdam
The network of bicycle paths reached 870 miles and funds were made available for future expansion and improvement[9]. An American journalist of the time described the bicycle in the Netherlands as “almost a part of the body” and joked that in the future, Dutch babies would come “into this world on tiny bicycles”[10].
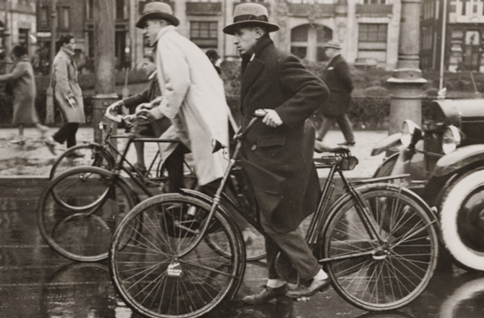
Source: Beeldbank Amsterdam
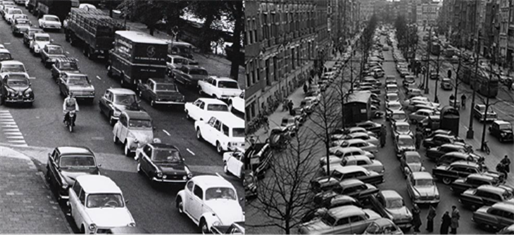
One of the reasons for this boom was the hyperinflation in Germany after World War 1, which made bicycle more affordable for a larger group of people[11]. However, this period also saw the appearance of the automobile on Dutch roads and, for the first time, local government authorities had to deal with unprecedented challenges such as bottlenecks, crashes, and early traffic congestion. City councils and traffic departments began an early road expansion and regulating traffic speeds. In the urban context, segregated cycle tracks were introduced, mostly to push cyclists aside. The upper-middle class culturally shifted from cycling to promoting car use. Local governments, including bicycle-friendly Amsterdam, began to frame bicycle traffic as a threat rather than a solution to be embraced. In a public report of the 1930s, the City Department of Public Works argued that the Netherlands was “lagging behind” the U.S. in terms of car ownership[12]. Despite the image shift, cycling was the most popular transport mode in the country. In Amsterdam, the modal share of cyclists was about 70% to 80% of total traffic. This continued to be so until after the Second World War. Bicycle clubs and advocacies, initially, strongly opposed segregated bicycle tracks and bicycle lanes as they perceived them as a threat to their rightful access to public space. However, their position and expertise was soon challenged and marginalized by new emerging professional figures such as civil and traffic engineers whose main role was to plan future cities following the functionalist principles of segregation of space. These new figures also had a proactive role in paving the way for the later car growth. This mass-motorization did not happen until the 50s as World War II and German occupation delayed this development. This late motorization must be considered of great importance as the bicycle continued to be very present in Dutch society until the 60s.
| Government | Planners | Bicycle organizations |
|---|---|---|
| Cycling started to be considered a mode of the past, but government officials had to deal with it as cyclists outnumbered cars by far. | Traffic and civil engineers emerged as the new professional figure able to solve the puzzle of mobility by focusing on separating modes and on how to maximize car speed, reduce travel time and achieve better flows. | Cycling clubs begin to lose importance in planning. They strongly contested segregated infrastructure as a threat to freedom of movement and saw bike lanes as a violation of people’s right to access public space. |
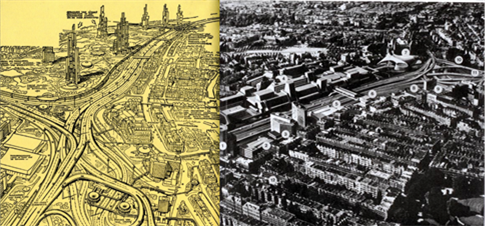
The need to rebuild the country offered Dutch planners and policy-makers an opportunity to realize the blueprints of a modern car-based transport system. Political parties of all ideologies supported and promoted car use. On the one hand, mass motorization was seen as the expression of modernism, self-determination and industrial power, on the other hand, the automobile was also framed as the symbol of social redemption and freedom for the working classes. In addition, the (perceived) feeling of flexibility and independence promulgated by commercial advertisement and abundant cheap oil, reinforced the image of the car as the icon of progress. The (initial) comparative advantage over other modes and the benefits of fast travel, long-distance accessibility, and the capability to carry heavy weights, became solid arguments to increase funding to accommodate the “inevitable growth” of cars. This prompted roadway expansion, filling up canals, pulling down houses and building sub-surface roads. This, coupled with a flourishing economy and increasing domestic income, contributed to a car boom.
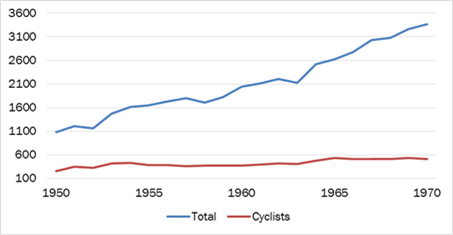
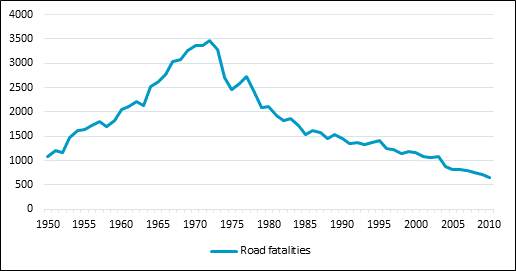
The number of private cars increased from 139,000 in 1950 to 3.4 million in 1975 (Graph 1). The average number of miles traveled followed an exponential increase from 2 billion miles in 1950 to 55 billion in 1975.
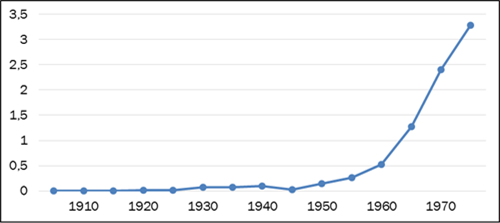
Source: SWOV (2010)
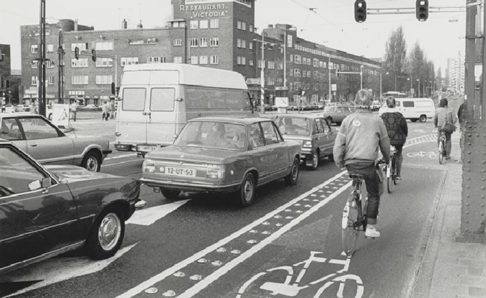
At the same time, plans were made to allow direct access by car to city-centers at the expenses of some historical buildings and neighborhoods. Squares were turned into parking lots and the cycling infrastructure was partly eliminated as it was assumed that bicycles would eventually disappear. However, the rapid growth in car use and the sudden transformation of streets, from shared spaces to functionalist and segregated public utilities, led to growing problems in terms of road congestion, road fatalities and quality of life.
Source: Beeldbank Amsterdam, University of Amsterdam
Case: The White Bicycle Plan
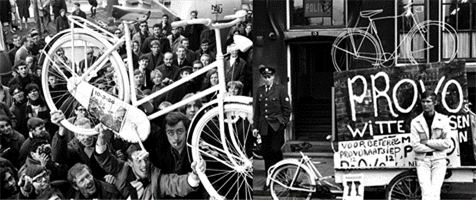
In July 1965, the Provo’s – an anarchistic political organization involved with social and environmental issues and with strong views against mass motorization – released the “White Bicycle Plan” in Amsterdam. Fifty white painted bicycles were left permanently unlocked, and placed throughout the inner city for the public to be used freely. Although this utopist measure did not last more than a few days as either the people would steal or the police seize them, the idea had great resonance all over the world and it is considered the first example of bicycle share system.
Source: Beeldbank Amsterdam; Shaheen et al. (2012)
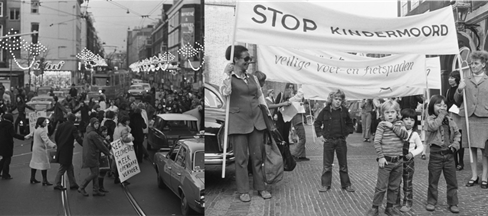
What caught attention particularly was the so-called “slaughter of kids”. Over 400 children were killed in traffic crashes in 1971 alone. As a result, parents took to the streets and campaigned to “Stop de Kindermoord” (or to stop the child murder) and asked for safer, quieter streets for children to play in.
Source: SWOV (2010); CBS Historical database; Rijksoverheid (2010) reworked by Decisio
These were later joined by other grass-roots movements, who strongly and violently opposed the development path undertaken by the Netherlands, such as the Provos and the Dutch Cyclists Union (Fietsersbond) - established in 1975.
Source: Beeldbank Amsterdam
The Second Report on Spatial Planning ("Tweede Nota over de Ruimtelijke Ordening"), published in 1966, included a finely meshed highway network with a total length of 3300 miles for the year 2000 based on an extrapolation of the rapidly growing car mobility at a time when only 370 miles of highways were available. This plan was a symbol of the belief in pro-car policies.
Then, in 1972 a report by the Dutch Economic Research Institute (NEI) calculated that meeting the needs of such car ownership growth would have had required an investment of a total between 15 to 22 billion guilders (8 to 15 billion US dollars[13]) in roadway expansion till 2000. The outcome of the report had a huge political impact. The financial implications required to pursue such development, combined with protests, was politically unacceptable and it was evident that the trend towards car-oriented infrastructure had to be broken. The Ministry of Transport and Water management concluded that priorities had to change and quality of life and a safe environment had to be prioritized over traffic flows. However, the turning point that led to a shift was the oil crisis in 1974 that halted the country. This, reinforced by the 1980 economic recession, created an important window of opportunity for cycling advocates to promote cycling as the tool for sustainable, healthy and livable cities for everyone. Cycling could not be ignored anymore and policy makers needed to include cycling infrastructure in their plans and visions.
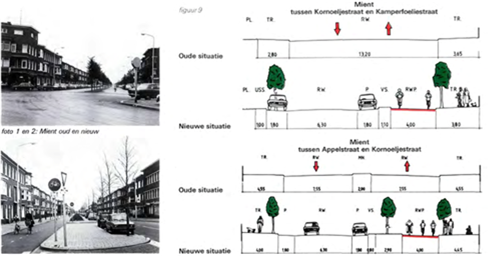
Case: “The Battle for Nieuwmarkt (Amsterdam)”
An iconic event that profoundly changed Amsterdam’s policy approach to transport was the 1975 plan to tear down the Nieuwmarkt area (An historical neighborhood right at the center of Amsterdam, see Figure 12 and 13) to make room for a metro line, an “urban highway” and a brand new central business district (CBD) with offices, university buildings and luxury shops (Figure 14 and 15). This “modernist” vision clashed with the needs of local residents who stood up to protect the historic and iconic value of the neighborhood (Figure 17). The fierce resistance forced the municipality to change their approach favoring a human-scaled development: dense and diverse neighborhoods, small scale buildings, low traffic speeds and priority for pedestrians and cyclists (Figure 18 and 19). Figure 16 reveals what’s left from the construction of the metro line. Of the vision proposed in the 70s, the metro remains the only project that was accomplished. Today, the neighborhood is a lively and commercially busy area that attracts international and domestic tourism.
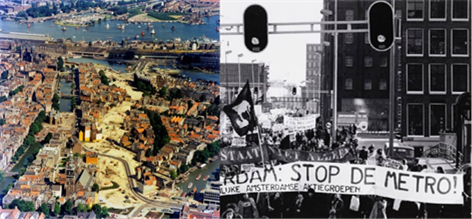
Source: ANP Historisch Archief; Beeldbank Amsterdam; Bicycle Academics; University of Amsterdam; Paolo Ruffino.
| Government | Planners | Bicycle organizations |
|---|---|---|
| Acknowledge that cycling was part of Dutch culture and an efficient mode of transport. | Planning shift to preserve functional mix, constrain car use and promote bicycle and public transport use. | Regain advisory role, use the window of opportunity to insert cycling in the political agenda. |
From the late 1970, municipalities kick-started the implementation of cycling infrastructure. In 1976, the Ministry of Transport, Public Works, and Water Management, issued the Multiyear Plan for Passenger Transport 1976-1980, which, for the first time, had significant attention for cycling. This plan included so-called "demonstration bicycle routes" in the cities of Tilburg and The Hague and meant to encourage cycling and inspire other municipalities to develop similar projects (see figure 20).
Source: Dienst der Gemeentewerken ‘s-Gravenhage (1978)
These successful experiments encouraged the Ministry of Transport to adopt two schemes for the implementation of cycling infrastructure at the city level. Municipalities were subsidized up to 80% of the construction costs to implement urban cycling infrastructure. Provinces and other municipalities were able to get 50% subsidy on the costs to upgrade and expand bicycle paths along secondary and tertiary roads. This financial injection rose from 25 million guilders (9.5 million dollar) in 1976 to 53 million (20 million dollar) in 1982. The goal of the Multiyear Plan for Passenger Transport was to get 90% of secondary roads and approximately 70% of tertiary roads covered by bicycle infrastructure (inside as well as outside urban areas). The value of such contribution is reflected by the length of cycling infrastructure, which grew from 5.780 miles in 1978 to 6.200 miles in 1988. Of great relevance is the case of Delft. In 1979, the city of Delft was the first city to draft a cycle plan which included a proposal for a whole city-wide cycle network as well as a five-year investment program. Between 1982 and 1986, the city received a total of 29 million guilders (12 million dollar) of funds from the Dutch Ministry of Transport to upgrade its bicycle infrastructure, including tunnels and bridges. A condition for the national funding was to study the effects of the plan. This was done extensively with before and after studies in no less than 21 reports[14]. Bicycle use increased by 6% in those years and car growth reduced by 3% in the intervention area, while the number of crashes decreased. The main findings of the studies were that cycling infrastructure expansion is a key factor. In particular, cycling becomes attractive when attention is paid to directness, comfort and safety of the network[15]. However, adding bicycle lanes is not enough. Simultaneous implementation and execution of policies to improve road safety and comfort for cyclists and at the same time change policies for car use (for example by means of paid parking and partially car-free city centers) might help to stimulate bicycle use. Finally, integration between public transport and cycling, as well as continuous information to the public is fundamental.
Source: Beeldbank Amsterdam
This contribution was halted in 1985 and the budget decentralized to the municipalities through general taxation, partially as the result of the general effort to decentralize government tasks. This great financial injection was thus greatly reduced. However, the government continued, where possible, to subsidize important high quality tracks to encourage a shift from cars to cycling.
Source: Oldenziel & de la Bruhèze (1999)
In November 1988, the “Second Structure Scheme for Traffic and Transport, Part A: Policy Plan” reported that unnecessary car travel had to be tackled to improve the road accessibility for “economically essential mobility” and freight while simultaneously improving the quality of life. This resulted in a specific task force to develop comprehensive bicycle policy, which resulted in the formulation of the Bicycle Master Plan (BMP)[16]. The overall objective of the BMP was to promote the attractiveness and safety of cycling in an integrated logic with transport, while simultaneously discouraging car use[17]. The strategy was to stimulate local authorities, companies and organizations, and public transport operators to incorporate bicycle policy in their regular policies and activity programs, so that the BMP goals could be achieved in the long-run. The plan encompassed 112 innovative and pilot projects and included substantial financial incentives from the national road fund to subsidize regional authorities in their construction of bicycle paths between villages and towns and the implementation of larger projects such as bicycle tunnels, bridges and parking facilities. Moreover, the BMP intended to provide authorities with relevant knowledge and assist them with arguments, instruments and measurable targets. Communication and behavioral campaigns were also adopted and marketing campaigns launched in various mainstream media. The BMP was supposed to be a three-year project, but then it was extended to a 7-year plan until 1997. The effects of the Bicycle Master Plan have been evaluated as highly effective (Fietsberaad).
During the same period, the policy “Sustainable Road Safety” (“Duurzaam veilig” in Dutch) has been implemented as an approach to achieve better road safety. The term “sustainable” was based on the Brundtland report as a “development that answers to the needs of the present generation without harming future generations’ possibilities to answer to their own needs”. The main objective of Duurzaam Veilig is to prevent severe crashes and injuries. It was introduced and adopted by all road managers in 1992 and revised and extended in 2005. The policy included principles of infrastructure design with the behavior of all road users in mind (this is discussed in details in Chapter 3). Special attention was payed to vulnerable road users such as children, pedestrians and cyclists. Innovative is the incorporation of the unpredictability of human behavior. Roads and vehicles, according to the policy, had to be adapted to incorporate these principles, leading to a fundamental revision, which in turn seriously reduced traffic crashes. Still today, roads are being redesigned according to the Sustainable Road Safety principles.
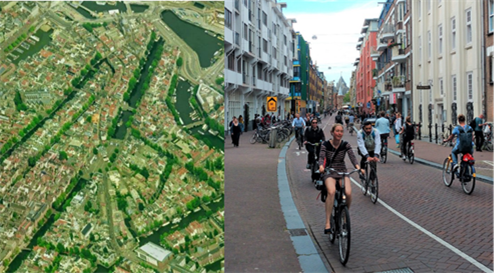
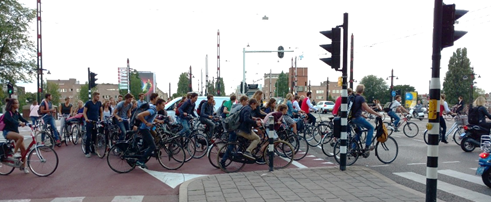
Currently, over a quarter of the total trips are made by bicycle, the highest modal share in the industrialized world, and a network of over 24.200 miles of bicycle paths crisscrosses the entire country.
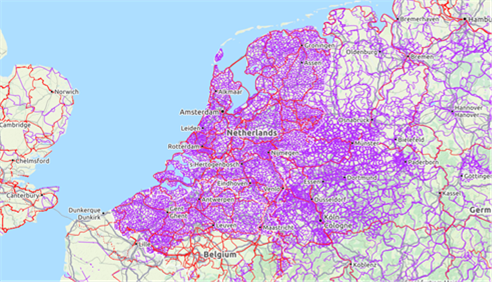
Source: OpenCycleMap.org
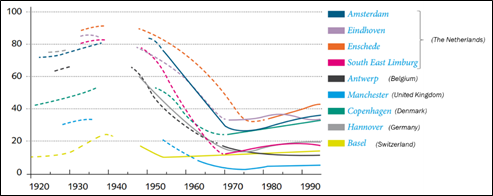
The combination between high quality cycling infrastructure and the establishment of a road hierarchy with large traffic-calmed areas where through traffic is diverted outside city centers to the freeway network, has resulted in an 80% reduction in the number of both car crashes and bicycle fatalities (predominantly bicycle-motor vehicle crashes) per 600 million bicycle-miles travelled over a thirty years period[18]. This, in spite of increasing car ownership and use[19].
Source: SWOV (2010)
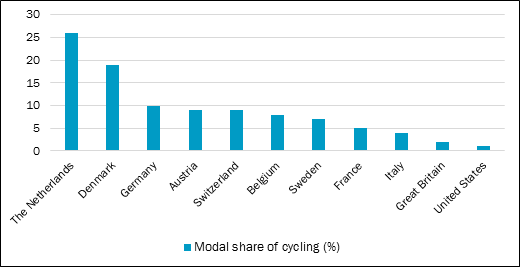
Source: CBS (2016); OViN (2016); CROW (2009), ECF (2015) and Istat (2015); NCBI (2009)
As a result, cycling has reverted its decline and it is now booming again. Since 2005, both the number of users (+11%) and the distance travelled by bicycle has increased (+10%)[20]. On average, the ordinary Dutch person cycles 600 miles per year, which is 40% more than in 1975. Part of the increase has been favored by the diffusion of e-bikes, which enable longer distance accessibility to a broader range of target groups including elderly and young adults[21].
Source: Paolo Ruffino (2016)
Such high bicycle use positively contributes to Dutch society in terms of health, livability and accessibility which translates into considerable economic benefits for individuals, companies and the government[22]. At the national level, the direct economic benefits, in terms of employment, bicycle production, and turnover have been estimated to be about € 1,3 billion yearly (USD 1,5 billion per year). A figure that is conservative as it does not include jobs and revenues that are indirectly produced or induced[23]. If the social benefits are accounted, this figure grows exponentially. For example, a study performed by Utrecht University shows that cycling saves 19 billion euro (USD 20 billion) yearly in healthcare costs and prolongs the average life expectancy by six months[24]. At the local level, the benefits are also substantial. The cycling “gross domestic product” of Utrecht has a direct economic value of € 38 million (USD 44.6 million) per year and the increasing number of kilometers cycled instead of driving avoids over € 250 million (USD 295 million) annually of social costs (pollution, congestion, productivity loss, etc.). In turn, car drivers and the public transport system benefit from cycling in terms of lower travel times, better accessibility and, increased safety. This is evidenced by a study performed by Waze which ranks the “Driving Experience” of The Netherlands to be the best in the World[25]. Hence, the investments to promote cycling while discouraging private motor vehicles have proved to be beneficial for all road users.
The impact of cycling goes beyond “financial” effects. It also contributes to social cohesion, community building, social capital, livability, freedom and inclusion for a broader range of target groups. Thanks to the safe cycling infrastructure, more than two-thirds of secondary high school students commute to school by bicycle, while 5% only are taken by car[26]. For these reasons, cycling is included in multiple policy domains and the Netherlands keeps promoting bicycle use by investing in cycling projects, socio-technical innovations and behavioral campaigns. At the present time, the Netherlands is the country that the most invests in cycling projects per person, circa USD 35/inhabitant per year.
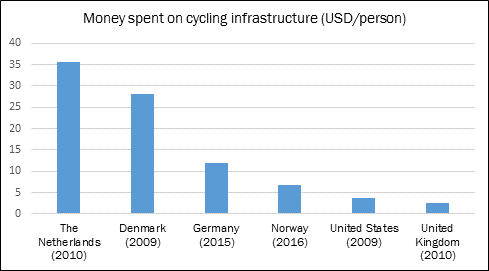
Source: ECF, 2016a; Pucher & Buehler, 2012; DCE, 2009; German Federal Ministry of the Environment; 2015; Decisio, 2016

