U.S. Department of Transportation
Federal Highway Administration
1200 New Jersey Avenue, SE
Washington, DC 20590
202-366-4000
Source: Paolo Ruffino (2015)
A conceptual definition of cycling policies is “a set of actions, rules or guidelines adopted or issued by an organization (public or private) with the intention to achieve an outcome on bicycle use”[28]. These can be broadly classified between, hardware, software, orgware and knowledge[29].
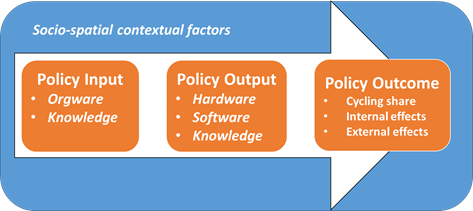
Source: Harms et al. (2015) adapted by Decisio
Hardware are physical measures including different types of infrastructure including cycle tracks, bike lanes, bicycle bridges, tunnels and bicycle parking facilities. The implementation of an extensive and comprehensive network of cycling infrastructure is a key prerequisite, because it provides the basic safety level needed to encourage people to shift to cycling. Moreover, ensuring a high-quality cycling experience by means of comfortable, direct and attractive routes is fundamental to strengthen the position of cyclists on the streets. The five main requirements for a high-quality bicycle-friendly infrastructure are expressed in the Design Manual for Bicycle Traffic by CROW[30] (for further explanation and technical details see Appendix 2)[31]:
These requirements are based on the Sustainable Safety policy which underpins the Netherlands’ approach to road safety and road design. This policy is further explained in the paragraph below.
Adopted in 1997 and revised in 2005, Sustainable Safety policy can be classified as a “systematic approach” (or Vision Zero) to road safety. Unlike the “reactive” approach which focuses on identifying and fixing black spots where an unusual number of crashes occurs, the Dutch system systematically eliminates all potential sources of risks at their root by incorporating two important human properties[32]:
Examples of these properties are functionality of roads, homogeneity, predictability and forgivingness. Although they are not compulsory or required by law, the Sustainable Safety principles are widely applied to re-design roads as several ex-post studies have proved to increase safety (for a more technical explanation see Appendix 2). Table 1 below lists and describes the principles, while Table 2 shows some concrete examples:
Source: SWOV (2005)
Source: Paolo Ruffino (2015; 2016)
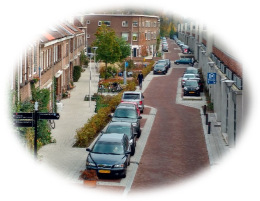
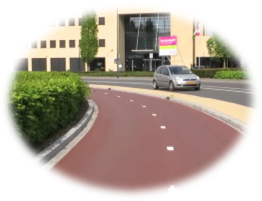
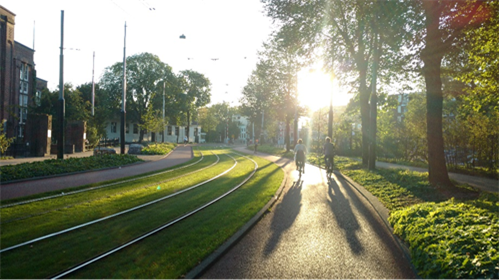
In the last decade, the concept of unbundling of car network from the bicycle network and public transport network has become prominent. In a nutshell, the term “unbundling” is used to describe a strategy to disaggregate different road networks (car, public transport, pedestrian and cycle) as much as possible to minimize potential conflicts[33]. This means that the main bicycle network follows its own alignment as much as possible and intersects with other networks – especially main motorized arterial networks – as little as possible. For the bicycle networks, this form of separation can be achieved by using access roads in traffic-calmed areas, green and residential areas, and using bicycle tunnels and bridges (or other forms of segregated solutions) to cross distributor roads. This contrasts with the “complete streets” design policy in place in the United States which requires that streets need to be planned in order to give access to all users regardless of their mode of transportation Bicycle-only routes of high quality (within or between cities) are often used for longer-distance cycling for both commuting and recreation. These routes (usually longer than 10 miles) are either called snelfietsroutes (fast cycle routes) or fietsnelwegen (bicycle highways). These are usually bi-directional (circa 4 meters wide), follow a very straight stretch (with few ups and downs, curves or turns), traffic lights are absent, they are built with superior pavement quality (smooth red asphalt, ideal also for racing bicycles) and avoid crossings as much as possible.
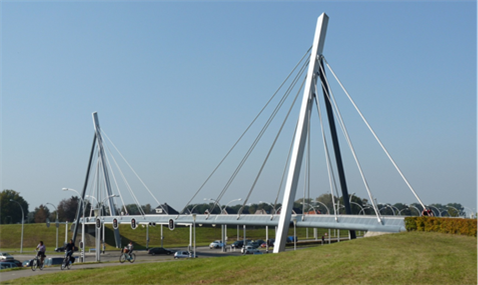
Source: Jeroen Buis
To ensure that this network-level separation does not impact the directness and convenience of the cycling network, measures to unbundle cyclist and vehicular are often combined with the creation of short-cuts. These can be contraflow cycling one-way streets and the creation of links accessible to non-motorized traffic only.
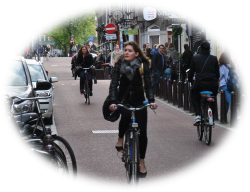
Unbundling offers multiple advantages compared to complete streets[34]. In the first place, it reduces the number of intersections and crossings with busy roads. This decreases the likelihood of bicycle-motor vehicle crashes. Secondly, bicyclists cycle through more pleasant areas with cleaner air. Thirdly, a higher modal share of cycling in traffic-calmed area mixed with motorized vehicles corresponds to a lower share of driving and greater awareness among drivers. This increases safety for all road users. The high incidence of cycling and behavioral adaptation of motorists in the presence of cyclists has the important effect of providing the so called “Safety in Numbers”[35]. Finally, unbundling prevents a high number of cyclists and motorists on the same intersections. This reduces complexity and increases the capacity of intersection, which again improves road safety
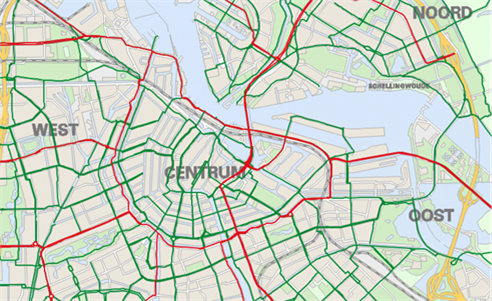
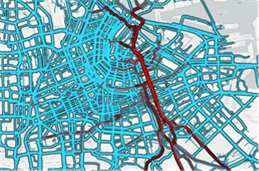
Source: City of Amsterdam (2016)
A practical example of network-level separation is the PlusNet of Amsterdam[36] (see Figure 28 above). The main bicycle network (green) and the main car network (red) are kept separated as much as possible. Although streets are generally accessible by any mode, different road design solutions are used to encourage different users to use specific roads. For example, the PlusNet for cars is characterized by multiple lanes and it allows higher volume of traffic and faster circulation. The PlusNet for cycling privileges green areas (such as the Vondelpark), traffic-calmed streets and also scenic streets (with historical buildings, canals and areas dense with activities). In most streets, no more than two PlusNets exist, for instance, public transport and bicycles, cars and bicycles or public transport and cars.
Source: Paolo Ruffino (2016)
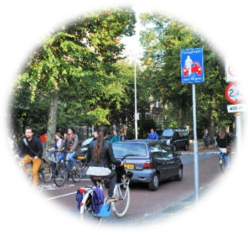
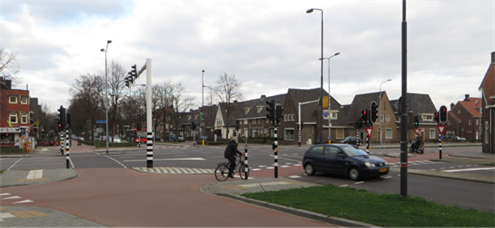
Another important element of road safety stemming from Sustainable Safety is safe intersection design. In many cities around the world, cycle tracks and lanes end where most needed, at junctions. These represent the location in which most conflicts take place due to limited visibility and differences in direction and speeds. In general, the most desirable situation is to unravel these different modes and thus simplify interaction between road users. In the Netherlands, for instance, traffic flows tend to be kept separated as much as possible both at junction and roundabouts. For segregated cycle tracks, the CROW cycling design manual recommends applying a segregated design at intersections. This means that cyclists turning right remain physically segregated from motorized traffic (see figure 30).
Source: Wagenbuur (2013)
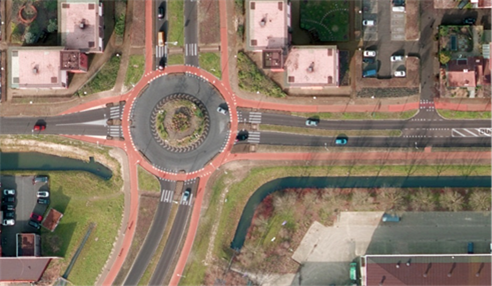
Dutch designed roundabouts lead to a significant reduction of traffic speeds and have led to a significant reduction of traffic crashes, making traffic much safer for cyclists and other road users when replacing un-signalized or signalized intersections. As at road sections, at roundabouts, there are three options: segregated cycle tracks, cycle lanes or shared use of the roundabout.
Source: Wagenbuur (2013)
Every junction presents different designs and applications of these concepts in order to meet the needs of traffic in the specific location. An interesting example is at the Valkenboslaan in The Hague where a complicated intersection with high traffic speeds has been replaced by an oval roundabout and a shortcut for cyclists (see pictures in Appendix 3).
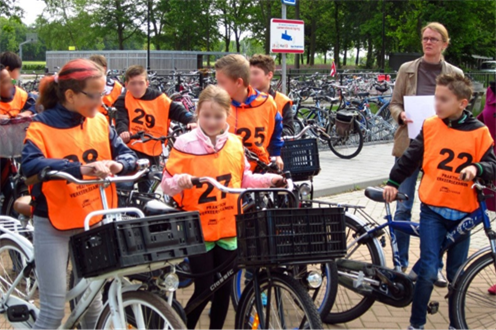
Along with physical measures, the Netherlands has introduced a number of soft measures that are designed to change perceptions, beliefs, and attitudes thereby motivating voluntary change in transportation choices[37]. These include education campaigns, information, and communication to the public. For instance, early school education programs such as bicycle traffic examinations (VVN Verkeersexamen) are employed in the Netherlands to raise awareness among children about traffic safety and rules. In contrast with the Walk and Bike to School Day in the US, the VVN exams are an example of measures that structurally focuses on raising knowledge and awareness of traffic and the role of cyclists in it. It includes a theory component as a written test and a practical component which consists of a cycling trip.
Source: Deventer extra (2011)
Students are assessed for their behavior and confidence in using road facilities. Several studies argue that early education is a necessary condition for establishing cycling skills and habits that pupils are likely to retain as adults[38]. In addition, bicycle use does not only provide freedom and accessibility to a young population, but it also has a positive impact on mental and physical health. Furthermore, learning to interact with traffic at an early stage appears to make children more aware of traffic regulations and to learn to share public space with other road users[39]. Other important instruments include marketing programs and incentives. An example in the Netherlands is the “Fiets Kilometervreter” (Kilometers eaters), a form of monetary incentive for cycling that gives access to discounts on selected shops. Currently, this form of incentives is not country wide but experimented at specific locations and with different initiatives.
Knowledge relates broadly to produce, gather, mobilize and use (scientific) knowledge and data. For instance, different professions exist around cycling and universities, both scientific and technical. These professions address the topic of bicycle planning and design from multiple perspectives: civil engineering, human geography, urban and regional planning, anthropology and transport economics. Hence, traffic experts and planners possess a broad knowledge and expertise in this field.
In 2001, the “CROW Fietsberaad”, a knowledge center for cycling policy of the Dutch government, was founded on the initiative of the Ministry of Transport (now Ministry of Infrastructure and Environment). CROW is funded by the government and plays an important role in carrying out development, dissemination and exchange of practical knowledge for cycling policy. The main activities are:
In addition, and as part of the Bicycle Masterplan, the magazine “Fietsverkeer” was introduced and is still published every 3 months free of charge for professionals that plan and design for cycling at government organizations (municipalities etc.) and in the private sector. CROW also actively maintains relationships with the private sector and NGOs to find new solutions to pressing problems such as bicycle traffic and parking issues.
Another important building block for bicycle planning is the systematic data collection. On a national, regional and metropolitan level, aggregated data is constantly collected by CBS, the national bureau of statistics. At the operational level, data is usually collected directly by municipalities by means of traffic counting systems. More recently, innovations such as the Fietstelweek (or Bicycle Count Week) has been introduced. This is a national cycling survey that takes place once a year.
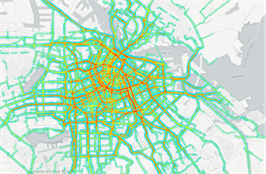
Intensity of use (red = preferred routes)
|
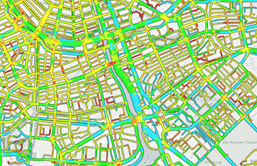
Average speed (blue faster, red slower)
|
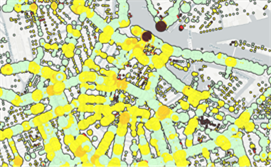
Delay (darker color = greater delay)
|
Origin & Destination[40]
|
Source: BikePrint (2017)
Developed as a joint initiative of the Dutch Cyclists’ Union (Fietsersbond), government authorities and several companies such as Keypoint, Beaumont Comunicatie, Mobidot and universities of applied sciences, it was first tested in 2015. The program works by downloading an application on the smartphone. The application counts and registers each participant’s movements while active. The results are displayed in the form of heat maps that are able to support planners in identifying the most frequently used roads and the location in which prioritize interventions. In particular, it allows for insights into:
This data is publicly available and retrievable at http://www.bikeprint.nl/fietstelweek/. From the last survey, it appeared that more than four out of five Dutch inhabitants own a bicycle. On average, bicyclists cycle 1,5 miles a day at an average of 9,5 mph. An example of ways in which this data is used is shown in paragraph 3.2.1. where it has been employed to appraise the effects of a bicycle route improvement in the area of Hoofddorp.
Although bicycle planning is mainly domain of Dutch municipalities, it is common practice to involve multiple stakeholders from different levels (government, provinces and city regions) and domains (both private and public) during all phases (from problem definition to implementation and evaluation). Effective governance arrangements (or what are here defined as “orgware”) are crucial to ensure homogeneity of interventions, identify common goals, share responsibilities, resources and risks, and provide adequate services to the end-user. This is especially the case when large (intercity) infrastructural projects are implemented. For example, public--private partnerships between municipalities, transport authorities and other stakeholders are formed when implementing and managing large bicycle parking facilities at stations. The table below briefly describes some of the main stakeholders in cycling projects as well as their role and responsibilities.
Actor |
Description |
|---|---|
Municipality |
Direct role in developing a cycling strategy and stimulating bicycle use by planning and implementing infrastructure (bicycle parking, bicycle network, constructing missing or weak links) but also combating bicycle theft, promote safety, and monitor progress. Direct funding of infrastructure and access to state subsidies. Together with Provinces, cities are responsible to ensure policy cohesion at the regional level. |
Provinces, transport regions and water boards. |
Leading role in determining and bridging regional / inter-local bicycle network. Focus on both utilitarian and recreational purposes. Coordination and co-funding of projects. |
Central government |
The government role is to promote decentralization and to provide a framework. Currently the main activities are four: 1) provide general guidelines 2) looking after intrinsic issues (legal aspects of traffic) which can only be arranged at the national level 3) funding of decentralized bicycle policy 4) support of decentralized bicycle policy with knowledge development and distribution. |
Dutch Railways (NS), Pro-rail and local public transport companies. |
Given the strong interaction between the bicycle and public transport, transportation companies are commonly involved in planning processes when it comes to co-finance and manage, for example, bicycle parking facilities at transportation hubs. Additionally, NS has also implemented a popular bike rental scheme, known as OV-Fiets, in over 300 locations (especially nearby stations) around the country. |
Advisory bodies |
Linked to knowledge development, several advisory bodies constantly support bicycle policy. Together with the already mentioned CROW/Fietsberaad, KpVV supports the decentralized authorities with practice knowledge on safety, mobility and infrastructure, the Fietsersbond (cycling association) is the interest group for cyclist which monitors activities and benchmark cities’ performance. Stichting Landelijk Fietsplatform, or national cycling platform association, focuses on recreational cycling. |
The Netherlands may represent an inspiring model in many ways. However, the country still faces numerous challenges. First, bicycle parking issues are increasing in cities, particularly at railway stations, as bicycle use increases. Secondly, bicycle theft is also an unresolved phenomenon that requires increasing attention and innovative solutions. Thirdly, immigrants tend to cycle less than the locals. Statistics show that even second generation immigrants from these countries cycle much less than the Dutch. Fourth, one type of motorcycles with a legal maximum speed of 15 mph, are allowed on the bicycle paths, and represent a main source of complaints from Dutch cyclists.
Figure 33 Scooters on bicycle paths
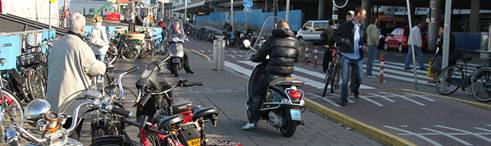
Source: Fietsersbond (2014)
Currently new legislation is under development to enable road authorities to ban these motor cycles from the cycle tracks. Finally, the shift from car to cycling appears to have a negative effect in terms of single-bicycle crashes which are becoming increasingly frequent leading to substantial medical costs[41]. For instance, each year 46,000 injuries are registered by the Accident and Emergency departments. Of these, approximately 6,000 victims are admitted to hospital in the NL. Most of these, are often not reported and their number is hardly known with certainty[42][43]. The most vulnerable target group are people aged 65+ who have a greater risk of injury compared to the younger population. Hence, the benefits of shifting from car to cycling may result, in some cases, unequally distributed among ages.