U.S. Department of Transportation
Federal Highway Administration
1200 New Jersey Avenue, SE
Washington, DC 20590
202-366-4000
Transportation policymakers, management, and staff continually must make decisions about the design and operation of the highway system. Making informed decisions on matters affecting highway safety is difficult because it requires an understanding of how safety is affected by the geometric design of the roadway, selection and placement of roadside hardware, use of traffic control devices, size and performance capabilities of vehicles, and needs and abilities of users. This understanding can be developed only through sound analysis of information on crashes, enforcement efforts, driver characteristics, roadway geometrics, traffic control devices, traffic volume data, and the location of roadside hardware and obstacles. It is important, therefore, that these data be available in a timely manner in computerized files, and be easily linked so that data can be assembled rapidly and prepared for analysis.
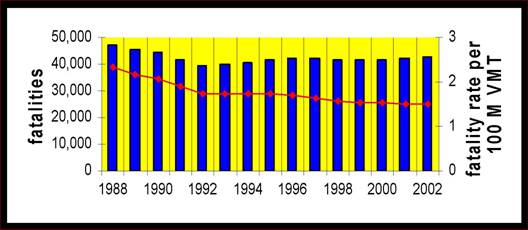
In the United States, the fatality rate per 100 million vehicle miles traveled (VMT) has essentially flattened. In figure 1, the bars show the frequency of fatalities, and the line shows the fatality rate. The U.S. Department of Transportation (USDOT) and other major stakeholder groups have adopted a goal to reduce fatalities to a rate of 1.0 by 2008. To meet this goal, it is more critical than ever to be able to analyze safety data to make informed decisions on the best methods for reducing fatalities.
 |
A disturbing trend has been discovered through State traffic records assessments promoted by the National Highway Traffic Safety Administration (NHTSA) and the Federal Highway Administration (FHWA), as well as a recent evaluation of States for possible inclusion in FHWA's Highway Safety Information System (HSIS). The completeness and quality of many States' safety databases are eroding. With reductions in staff and other resources, a smaller proportion of motor vehicle crashes are reported to State crash databases than ever before. Crash thresholds are increasing to the point that any meaningful analyses are problematic, and because of data entry backlogs the information is outdated by the time the database is available for use. While States are increasing their use of geographic information systems (GIS) technology, they are not adequately maintaining or linking a record of the roadway characteristics associated with specific locations. Core data elements such as number of lanes, lane widths, shoulder widths, median type, and median width are missing in many systems, and items such as horizontal curve, vertical grade, intersection features, and interchange features are virtually nonexistent.
The highway safety community is working to create a brighter future for traffic safety information systems by searching for new ideas and ways of doing business. In October 2003, a panel sponsored by FHWA and the American Association of State Highway and Transportation Officials (AASHTO) conducted an international scanning study on traffic safety information systems. The objective of the panel was to seek innovative ways to build these systems by learning from countries that have achieved some level of success in designing, developing, and using them.
The panel conducted meetings with government agencies, academia, and private sector organizations in the Netherlands, Germany, and Australia. Discussions with these countries focused primarily on the following:
General issues of policy, systems, and linkages
Crash data collection and accessibility of routine and special traffic crash data
Roadway data collection and accessibility of data describing roadways, roadside appurtenances, traffic control devices, structures, and traffic volumes
Other traffic safety issues concerning driver information systems, enforcement, medical data, and adjudication
In addition, in a meeting with the European Commission in Brussels, team members discussed the European Union's (EU) efforts to combine minimal data from all EU countries into the Community Road Accident Database (CARE) for analysis and reporting of national statistics on crashes resulting in injuries and fatalities.
The most noteworthy similarity among the countries visited and the United States was the fact that fatalities have dropped significantly since 1980, but as shown in figure 1, the rate has been essentially constant in recent years. As in the United States, the countries the team visited face a drop in the documentation of crashes because their police agencies are unable to devote the necessary resources to this task. Each country is looking for new and innovative programs to improve marginal fatality rates while working with fewer resources and less traditional crash data than ever before.
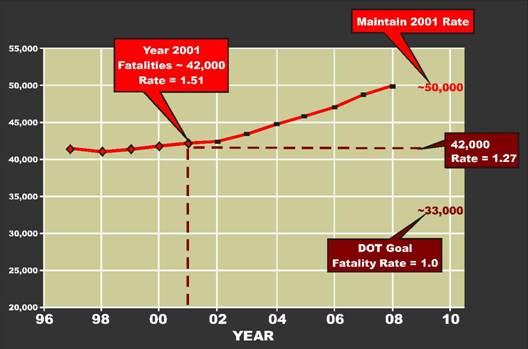
Where the similarity ends between the United States and the countries visited is in the emphasis the other countries place on strategic safety improvements as a core business function. In addition, the U.S. goal for reducing fatalities is not as ambitious as that of other countries. The European Action Plan that serves as the guiding plan for the Netherlands and Germany, for example, sets a goal to reduce the number of injuries and fatalities by 50 percent between 2000 and 2010. The State of New South Wales in Australia has set a goal of about 40 percent reduction by 2010, and the State of Victoria in Australia aims to reduce fatal and serious injury crashes by at least 20 percent by 2007. As shown in figure 2, the U.S. goal for reducing the number of fatal crashes is slightly more than 21 percent by 2008.
 |
A strategic safety focus requires top leadership involvement, participation, and monitoring. In each country visited, roadway safety is a core business function that is supported at the highest level by the minister of transport and legislative bodies. Clear measures to improve roadway safety are set at a national level and communicated consistently to the states (or countries in the case of the EU). Each state then develops supporting goals and accountability measures to accomplish the national objectives. Figure 3 is an example of the road safety structure in Victoria, Australia. Each piece of this framework plays a key role in furthering the state's goals for roadway safety, from the Ministerial Council that ensures achievement of a coordinated approach to the Community Road Safety Councils (CRSC) that identify issues through community consultation and plan development.
As is the case in the United States, competing demands have eroded the resources the countries have available to devote to roadway safety. In particular, fewer police-reported crash data are available to identify safety problems and evaluate program successes. While the countries visited are in the process of developing more advanced data systems, many road safety accomplishments have been made without the benefit of robust and linkable data systems. Creative methods for data estimation, linkage, and integration strategies are used to limit the amount of data collection required and help eliminate data inconsistencies. To obtain sufficient crash data in the Netherlands, estimations are made of the missing and underreported crash data, and safety goals are established based on these estimated data.
 |
The following are among the numerous methods used to obtain these estimates:
Biannual public surveys are conducted to obtain personal estimates of the incidences and injuries for crashes involving motor vehicles, pedestrians, and bicyclists. These surveys contain numerous questions about safety issues, and a return rate of about 70 percent is achieved.
To some extent, data from insurance companies are used to provide additional information about material damage-only crashes, as well as to verify estimates of crashes involving injuries and fatalities.
Hospital data, particularly from emergency room treatments, are factored into the estimation of crashes and injuries.
These estimations supplement police-reported crash data that have been evaluated carefully to determine the benefit-cost ratio of data elements collected. The Netherlands is seriously considering reducing the number of data elements collected by police officers from an already low number of 80 variables to 40 critical data elements. The EU aggregated database, CARE, requires only 43 data elements. All countries used indepth crash investigation studies to supplement their use of police-reported crash data for specific safety issues and research.
In addition to crash data estimations, the Netherlands has instituted an official "data-for-data partnership" to share information. Under a formal agreement between agencies, for example, an entire GIS roadway network file and capability for crash data analyses are provided to local agencies in return for their agreement to provide location coding for additions to the existing roadway network in their jurisdictions. In programs to improve crash data for safety analyses, each country worked extensively across agencies and jurisdictions to accomplish their goals.
Within the framework of making strategic safety improvements, roadway segments that may have potential for improvement before becoming "blackspots" (areas with high crash rates) are considered. Data are used to help support roadway work already accomplished, as well as proposed work. Benefit-cost analyses are continually applied and updated to justify the expenditure of resources for safety. In Australian states, for example, benefit-cost analyses are conducted first to justify a project, immediately after a project is completed to update cost measures, and then a year or more later to determine if intended benefits were indeed achieved.
An outgrowth of the proactive approach to roadway safety is communication to the public of safety issues, programs, and data that is of paramount importance in most of the countries visited. Numerous examples were provided to the scanning team of communicating safety issues, as well as training people to accept personal responsibility for avoiding involvement in crashes. These programs included the following:
Web-based applications allowing access to statistical crash and roadway data
Publications, billboards, and other public relations and marketing approaches to encourage crash prevention and train people to avoid crashes
A continually staffed service center to provide a call-in help desk where local jurisdictions and others can obtain statistical crash data and technical assistance
Marketing efforts to change drivers' attitudes to accept personal responsibility for staying safe
All of the countries visited use driver sanctioning as a means of improving driver behavior and roadway safety. Despite strong privacy laws in the Netherlands and Germany, some history and administrative information about drivers and vehicle owners are shared with law enforcement officials. Germany has an overall philosophy that sanctions lead to rehabilitation, and sanctions are removed from a driver's record at the end of the sanction period. German officials believe that sanctions should not be punitive. Instead, a driver who makes a mistake should be able to start again with a clean record. Australia uses a national driver database so driver sanctions and history are shared across the states to promote the concept of "one driver, one record, one license."
The goal of data estimation, sharing, and linkage is to simplify data collection in the field. To support German police officers, the German Institute for Traffic Engineering (a consortium of insurance companies supporting highway safety programs) provides extensive training programs and free crash data collection software. To varying degrees, the insurance industry served as a partner in promoting safety in all of the countries visited.
In addition to software to support crash data collection, the scanning team observed numerous other examples of new technologies being used to collect roadway data and existing technologies being used in new ways to support roadway safety programs. Use of GIS has become more important than ever to display data by location. This provides a method of analyzing disparate data from small databases without other means of linking these data. To support GIS efforts, extensive quality assurance steps are conducted to locate a crash or other incidents.
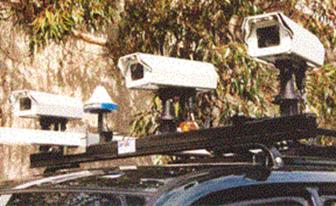 |
An example in Australia of using existing technology in new ways is the digital photographs collected during continuous roadway surveys. These digital photos are available online throughout the organization and are used to support crash data entry by helping to identify exact locations and roadway features surrounding the crash. This technology as deployed by ARRB Transport Research is shown in figure 4.
Another method for getting the most benefit out of existing technologies is to contract with private firms for the maintenance of equipment (traffic loops, for example) and require specific levels of service that result in no payment for times the equipment is not in operation.
The Australian states visited provided numerous examples of technologies used to maintain traffic flow and improve roadway safety. They included variable speed limit signs during peak congestion periods and adverse weather conditions, traffic loop data to capture tailgating information, cameras for monitoring heavy vehicles, and cameras to ticket drivers for speeding or running red light signals.
The scanning team identified numerous safety data issues in the host countries in the areas of strategy, efficiency, and utility. The team selected the issues listed below as the most important themes to be used to develop recommendations and implementation strategies.
Top-level State and national support needs to be demonstrated. National-level creation of a set of measures should be followed with clear communication to the States. State leadership, in turn, should work to develop goals and ways to assess completion of those goals.
Top-level meetings of stakeholder agencies in the public sector should have a singular focus on safety. Safety should be defined clearly as a core business, and performance measures should be established by which safety improvement can be assessed.
A main goal is to streamline and simplify data collection, especially for the law enforcement officer in the field. This requires a review of data requirements and an eye toward quality assurance and collecting only the information needed.
Current technology can be used more efficiently to simplify data collection (through linkage rather than field data collection) and improve overall data quality.
New technology can be used where it will increase efficiency and/or improve data quality by also decreasing the amount of data collected onsite and through the use of edit checks or other quality assurance methods.
Since use of safety data is a fundamental precursor to improving data quality, marketing traffic safety information is a crucial activity. Raising awareness of the issues and uses of data will in turn support data improvements.
Analytical tools that help users get the most out of data and support specific job functions such as performance monitoring, evaluation, and countermeasure selection are crucial. Increasing access to data and availability of user-friendly analytical tools will help ensure data quality improvements.
These themes, as well as supplemental implementation recommendations and strategies, are presented in more detail in the team's Scan Technology Implementation Plan. The team will share its findings and promote its recommendations to constituencies through distribution of this report, published articles, and presentations at meetings and conferences.
| << Previous | Contents | Next >> |

