U.S. Department of Transportation
Federal Highway Administration
1200 New Jersey Avenue, SE
Washington, DC 20590
202-366-4000
The agencies visited clearly documented system and organizational performance, often in detailed trends over a number of years. The richness of reporting and actions was usually quite sophisticated. The agencies demonstrated improved customer satisfaction, higher reliability in transit and highway travel times, reduced environmental impacts, and greater efficiencies. Their performance management systems naturally dovetailed with asset management systems. The agencies demonstrated a keen knowledge of system conditions, system trends, and finely calibrated system need estimates, often by asset type and region. Clearly, the agencies benefited from managing their performance to maximize resources, optimize assets, and earn credibility from legislators and budgeting agencies.
Despite those benefits to both legislatures and agencies, budget appropriations were for the most part not driven by the resources required to achieve specific performance targets. Generally, appropriations were not calibrated to the condition of specific asset classes. Performance management demonstrated how funds were spent and to what end, but the systems did not appear to include a feedback loop that triggered legislative appropriation decisions to sustain assets at an agreed-on level.
The scan team found no widespread evidence that legislatures or executive branch financial agencies establish asset investment levels based on data from performance management systems. Discussions indicated that this was because of overall funding constraints in competing public sectors, such as education and health care. It was not attributable to an ineffective performance management program or agency performance. Only New Zealand had a dedicated transport fund statutorily protected for transportation uses. All fuel excise duty is dedicated to transport. Excise duty is collected from gasoline sales, and light diesel vehicles and heavy vehicles pay road user charges based on vehicle weight and distance traveled. Other departments tended to compete with other government agencies for appropriations.
In three of the six cases, agencies reported discouragement that they could not convince legislators to invest more in system preservation, despite their sophisticated documentation of need. Further discussion noted that identifying large maintenance funding gaps was a longstanding concern. Similar to the United States, agencies had difficulty expressing the impact of changes in pavement and bridge condition at the political level.
Central government decisions on agency operating budgets tend to remain incremental. System preservation increases were modest and based on incremental increases from past budgets. Budget decisionmaking depended on whether the government had any residual revenue left once other priorities were met.
In Sweden, SRA officials presented three budget scenarios for long-term basic system preservation needs as part of a 10-year government budget forecasting effort. They presented a low, medium, and high scenario for the 10 years from 2010 to 2021. They presented a low scenario of SEK117 billion (USD16.7 billion) over 10 years, which would make it possible to sustain maintenance standards at a functional level. Investments would be limited to funding projects in the current plan and meeting immediate needs. In the medium scenario, they would meet 75 percent of backlogged maintenance needs. In the high scenario, a 31 percent increase, they would meet all maintenance backlogs. They received in the long-term budget forecast an estimated appropriation for maintenance of SEK110 billion for 10 years, or slightly less than their lowest estimated need to sustain conditions (figure 9, see next page).
"For a long time we have talked about the maintenance mountain, but the problem… is they can't translate that down to 'What does that mean?' We did get more maintenance money, but it came from politicians picking up the sentiment in their districts that there was discontent in the field. It became a political topic, more so than a technical debate" about how to fund maintenance, said an SRA official.
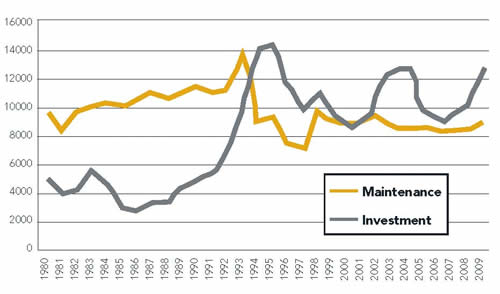
Figure 9. Swedish maintenance expenditures are below those for new investment.
In New South Wales, officials said the national government has held maintenance expenditures level for several years at an amount that does not provide long-term sustainable funding. They said they rely heavily on state revenues to maintain their system at an acceptable condition level.
Queensland officials produce a sophisticated asset deterioration analysis that monetizes the value of all assets and forecasts their deterioration curves based on current expenditures. Their analysis indicates that only about 50 percent of needed long-term investment in system preservation is occurring. Despite their sophisticated analysis, they have not been able to convince Treasury officials to support a larger investment in system maintenance.
Victoria highway officials manage their assets under the requirements of a Road Management Act that requires sophisticated reporting and forecasting of the effort level needed to sustain conditions at an acceptable level (figure 10). Even with the legislative foundation for identifying their maintenance needs, they said they struggle to convince central budget authorities to invest adequately in system maintenance.
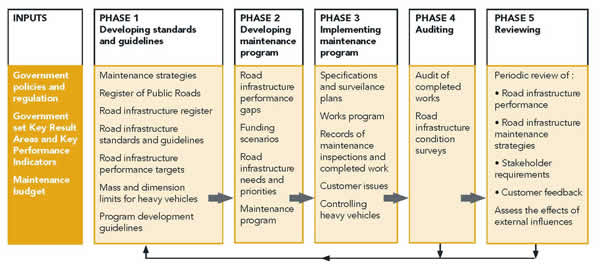
Figure 10. The Victoria Road Management Act requires a systematic and methodical asset management approach.
Although there appeared to be little direct linkage between system conditions and appropriations, the performance management systems were widely credited with documenting the agency's efficiency and helping to defend transportation appropriations during the budgeting process.
"Anything that focuses you on what you are actually achieving for your constituencies is worthwhile," said one Victorian official in describing how the agency uses its road condition data to defend budget requests.
One British official noted that while there is no mechanistic linkage between transportation condition targets and the budget set by legislators or Treasury officials, the performance results were considered important in budget discussions.
Another economic analysis common in the international agencies was the use of depreciation in networkwide assets to demonstrate financially whether the investment level is adequate to sustain the assets over time. The evaluation puts the issue of deferred maintenance into a quantifiable number that can be displayed as a liability on the organization's books. The value of this type of analysis is to demonstrate in financial terms whether states or nations are accumulating future costs that will have to be incurred to return the transportation network assets to a serviceable condition.
As a Swedish official said, it demonstrates to the central government the long-term costs of deferring maintenance. "We try to communicate that it is very expensive to be poor." A Queensland official said the depreciation forecasts compel Treasury officials to confront the fact that not investing adequately in infrastructure maintenance increases the amount of annual depreciation the government faces. "When investment decisions reduce funding to rehabilitation and resurfacing, there is still a cost to government."
Queensland Department of Transport and Main Roads displayed a sophisticated depreciation process, Roads Asset Valuation, that relies on four inputs:
From these four variables, the agency computes whether current investment levels are adequate to offset the continual depreciation or deterioration consuming the remaining useful life of the highway assets in service.
The agency derives the conditions of the assets from bridge, pavement, and other asset inventories. From the base case of conditions, the management systems are used to calculate the deterioration rate for each asset and the network as a whole. In an optimally funded program, the amount of improvement created by the capital and maintenance programs would offset the rate of deterioration across the network. However, Queensland officials were able to document that only about 50 percent of the level of maintenance investment was occurring to sustain the assets over time without significant depreciation in the value of the state's highway infrastructure. The extent of the problem was further exacerbated when construction prices soared between 2005 and 2008. That caused the future replacement value of the depreciated assets to increase significantly, widening the investment deficit the state faces in future years. Queensland officials said the analysis did not result in immediate increases in investment from Treasury officials, but it certainly "got their attention" that the state has a serious long-term infrastructure liability it needs to monitor carefully (figure 11).
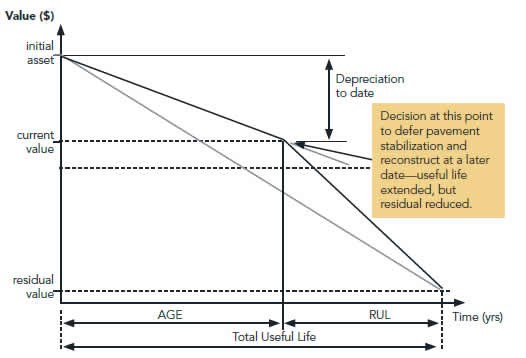
Figure 11. Queensland captures the long-term cost of deferred maintenance.
The road network infrastructure asset valuation brings together two areas of professional practice, financial management and road network asset management. The officials said the resulting closer communication has strengthened links between financial planning and asset planning, as required by the state's Financial and Performance Management Standard, published by the Queensland Treasury.
Queensland officials said the main purpose for valuing infrastructure assets is to generate information that will help them decide on the conduct of their core business. The department has articulated its vision for road network asset management as maximizing performance in a whole-of-life context in terms of safety, road user costs, community benefits, and government outlays.
Queensland officials have refined their depreciation process down to an individual element basis for many assets. It uses unit prices from its project-estimating system to value the replacement cost of individual assets, with variations captured for different regions. Both direct and overhead costs to replace assets are captured.
Similar depreciation models were cited in New Zealand, Victoria, and New South Wales. New South Wales officials called the product of their depreciation analysis a Capital Sustainability Index. It translates the needed maintenance investment versus the actual maintenance expenditures into a ratio. The index did not convince the central government to increase maintenance budgets, but the New South Wales RTA used it to redirect its resources to sustain maintenance conditions.
Although the performance management processes did not lead directly to consistent budget increases for highway preservation, the scan team found many instances of governments investing significant new sums to expand the transportation system. These investments were driven by broad national visions, such as creating livable cities, spurring economic investment, or linking regions by improving corridors. In short, striving for ambitious new visions rather than achieving narrow performance targets tended to motivate societies to substantially increase investment in their transportation networks.
All four nations the scan team visited had some form of major transportation investment initiative underway. Some were directly influenced by the economic downturn, such as Australia's Nation Building Program. New Zealand's government focused on investing in seven national corridors to create an enhanced network of Roads of National Significance. Great Britain recently committed GBP6.3 billion (USD10.2 billion) to rehabilitate and expand its busiest highway, the M25, and it is considering a high-speed rail network. Sweden used revenue from an urban pricing cordon to finance a new USD3.7 billion outer belt around its capital, Stockholm. The Queensland government was building a comprehensive network of busways to alleviate congestion. In Sydney, a gleaming new freeway tunnel completed a key missing link in the urban freeway network.
The relationship between the agencies' performance management credibility and the government's decision to entrust these agencies to manage massive new investments is unclear. It appeared to the scan team members, however, that the credibility earned by the transportation agencies for efficiency and competency had at least an indirect bearing on the government's decision to invest massively in new transportation infrastructure.
Australia's Infrastructure Act 2008 was intended to enhance the federal role in transportation by increasing federal coordination, planning, and financing for nationally important transportation projects. It created an agency called Infrastructure Australia in the national Department of Infrastructure, Transport, Regional Development, and Local Government. The primary function of Infrastructure Australia is to advise the minister, commonwealth, states, territories, local governments, investors, and owners of infrastructure on transportation needs, prioritization of projects, regulatory and price issues, options for reforms, infrastructure user needs, and mechanisms for infrastructure financing. In addition, it has authority to perform audits of the adequacy, capacity, and condition of the nation's infrastructure.
Infrastructure Australia is intended to develop a strategic blueprint for the commonwealth's future infrastructure needs. Its enabling act calls for it to work in partnership with states, territories, local governments, and the private sector while it develops advice to the governments about infrastructure gaps and bottlenecks that hinder economic growth. It also is charged with advising the commonwealth on investment priorities and regulatory reforms necessary for the timely delivery of infrastructure projects.
The central government also developed a concurrent financing program called the Nation Building Program. It is intended to be an AUD26.7 billion (USD21.2 billion) highway and rail development program for 2009 to 2014. It calls the program the largest land transport program in the nation's history. To put that amount of investment into perspective, a U.S. highway and rail program of the same size on a per capita basis would total USD316 billion. The fiscal year 2009 authorization under U.S. transportation legislation was just under USD40 billion for highways.
The government also appointed an infrastructure coordinator to lead an Office of Infrastructure Coordination, which will identify needs, advise the commonwealth on projects to select, and coordinate the efforts of states, territories, regions, and cities to develop an integrated transportation network.
Infrastructure Australia also was tasked with conducting studies of the adequacy, capacity, and condition of nationally significant infrastructure. Its assignment is to anticipate levels of growth and the adequacy of the national network to accommodate it and, from its analysis, develop a national infrastructure priority list for the Council of Australian Governments (COAG) to consider. COAG is a statutorily created council of the prime minister, state premiers (governors), territorial chief ministers, and the president of the Australian Local Government Administration. The following are other duties of the coordinator:
Infrastructure Australia will also be asked to review the extent to which the government can facilitate infrastructure investment, including improving guidelines for public-private partnerships, project appraisal techniques, and planning and approval processes.
In its Government Policy Statement, the New Zealand national government clearly emphasized enhanced transportation investment as a key strategy for improving the economy and increasing the nation's economic competitiveness:
"The government's priority for its investment in land transport is to increase economic productivity and growth in New Zealand. Quality land transport infrastructure and services are an essential part of a robust economy. They enable people and businesses to access employment and markets throughout the country and link them to international markets through the nation's ports and airports. Investing in high quality infrastructure projects that support the efficient movement of freight and people is critical."
The government, elected in 2008, created a new office, or portfolio, for infrastructure to develop a 20-year plan for the nation's total public infrastructure system, including transportation, schools, prisons, hospitals, and housing. The Treasury established an Infrastructure Unit to carry out the government's infrastructure goals. An Infrastructure Advisory Board, which includes stakeholder representatives from industry, local government, and the public sector, will provide independent advice to the Infrastructure Unit and the minister of infrastructure. It will also help coordinate the development of the National Infrastructure Plan and monitor progress on the objectives of the plan after it is released.
The government listed seven initial Roads of National Significance for priority in investment. Its emphasis is to focus investment to achieve economic growth and productivity on the roads:
Its Government Policy Statement emphasizes its intention to focus investment on these major corridors on the national network:
"These are seven of New Zealand's most essential routes that require significant development to reduce congestion, improve safety and support economic growth. The purpose of listing roads as nationally significant is to ensure these priority roading developments are taken fully into account when the NZTA develops the National Land Transport Programme. Planning for the future development of the land transport network should reflect the importance of these roads from a national perspective and the need to advance them quickly. The National Land Transport Fund can be used for the future development of the Roads of National Significance. Roads of National Significance will be part of the National Infrastructure Plan. Further Roads of National Significance may be added over time."
The government specifies that expansion and improvement of the state highway system should receive 33 to 34 percent of the total transport budget. To help increase investment in the state highway network, the government moved about NZD130 million (USD96 million) in nonhighway expenses from the dedicated land transport fund, which is paid for primarily through fuel taxes and road user charges, to the state's general fund, increasing overall transportation investment. Therefore, the New Zealand government made highway investment a priority and achieved this by the following:
Great Britain is pursuing a massive rebuilding of its most important highway, the M25, while also exploring the development of a high-speed rail network, improvements to conventional rail service, and the upgrade of other priority highway routes across the country.
The largest active project is the GBP6.2 billion (USD10.2 billion) design-build-operate-finance widening and operation of the M25. It is one of the world's most heavily traveled highways with volumes of up to 200,000 vehicles a day. It is a ring road around London and forms the hub of England's motorway network. The majority of the contract value is in maintaining and operating the road over 30 years, but the project also includes widening nearly 100 km (60 mi) of the beltway.
In August 2009, British rail operator Network Rail released a study recommending a GBP34 billion (USD54 billion) high-speed rail line from London to Scotland with branches to the Midlands and Northwest. It promotes the line as a high-speed, low-carbon solution that will promote economic growth, environmental sustainability, and social inclusion.
Network Rail said the intercity service will save 300,000 tons of carbon emissions and 50 million hours of travel time in the nation. It said a detailed study concluded that a new 200 km/h (124 mi/h) high-speed line to the Midlands, Northwest, and Scotland would cut travel time to Scotland from London by half to just over 2 hours. The rail operator said its study concluded that the line will pay for itself and provide additional societal benefits, such as travel time savings, emission reductions, and the ability to use current intercity lines for local commuter traffic.
The Australian state of Victoria has embraced an ambitious AUD38 billion (USD35 billion) plan to reshape its urbanized areas around Melbourne by coordinating development in five urban and suburban hubs across the region. The plan also strengthens the connections among regional, rural, and metropolitan Victoria so all parts of the state share in prosperity. The Victorian Transport Plan is the government's statewide action plan for expanding the reach and capacity of Victoria's transport system over a 12-year period. Melbourne's population was about 3.6 million people in 2009 and is forecast to grow to 5 million by 2030. Transportation officials said 1,600 people a week move into the city.
Recently the city secured more than AUD3 billion (USD2.7 billion) from the central government for transit expansion (regional rail link) because the state demonstrated that it had an ambitious land use and transportation plan in place. State transportation officials said they and local officials share a vision to reshape the urban region into one that is sustainable and more compact and that has distinct hubs that efficiently integrate business, residences, and transportation. Victorian Department of Transport officials said they developed a shared vision to integrate the highway, transit, and rail systems into a network that accommodates the growth of the region without creating auto-dependent sprawl that could reduce the region's high quality of life. They said the main driver for the vision and investment is less a response to climate change and more a desire to develop a functioning transportation system to accommodate economic growth and quality of life.
In announcing the Victorian Transport Plan in 2008, the premier said the following:
"Our Government will deliver key transport projects over the short, medium and long term that will transform our State…. For the first time in the State's history, the Victorian Transport Plan is fully integrated with future land use planning-so that these investments will help shape sustainable, resilient and livable communities for the future."
The plan included the following:
"We can't shape our city if we don't have a transportation plan first," said a Victoria official.
He said the government is in favor of higher density development, but realizes that such development cannot be located only in the Melbourne central business district. He said the region desires five natural clusters of development, including the Melbourne central business district and four suburban hubs. The plan calls for developing infrastructure to support these five hubs without further stress on the transportation systems. Officials know they have to plan for another 600,000 suburban residents by 2030, as well as plan for growth in the central business district. "The challenge for us is to put transport in early ahead of the growth."
The Melbourne region already has one of the most integrated and diverse transportation networks in the world. It has more than 240 km (144 mi) of trams, extensive rail passenger service, and active cycling and walking programs and plans to expand those services. Officials recently announced the biggest rail project since the 19th century, which will include expansion of two new tracks to provide rail passenger service in the suburbs.
The state and Department of Transport also developed Freight Futures: Victorian Freight Network Strategy, which plans for an ambitious expansion of the freight network to accommodate growth in water, shipping, rail, and highway freight traffic. The plan says containerized shipments from its port are expected to grow from 2 million containers in 2009 to 8 million by 2036. It says that highway freight-kilometers of travel are expected to increase 70 percent and the number of trucks on the roads by 60 percent. The large majority of freight now moves by truck, but the freight plan calls for significant efforts to expand rail service. The plan also calls for 20 distinct freight strategies, including the following:
"Value for money" was a common theme the scan team heard during its study. The agencies continuously used benefit-cost analyses to evaluate projects and communicate their benefits to the public, stakeholders, and government. The use of benefit-cost analysis appeared to occur at both the project level to evaluate individual projects and the program level to consider overall investment levels. Reliance on benefit-cost analysis and the value-for-money concept appeared to be ingrained in the agencies, ministries, parliaments, and local government project sponsors. The smallest nation visited, New Zealand, had a 956-page Economic Evaluation Manual for highway projects.
The British Treasury published and updated a Green Book: Appraisal and Evaluation in Central Government, which requires five stages of evaluation of benefits and costs, not only for the selection of individual projects but also for the funding of government programs.
As the document states, "The purpose of the Green Book is to ensure that no policy, programme or project is adopted without first having the answer to these questions:
The Green Book describes the types of analysis that need to occur during policy or program development, when new or replacement capital projects are considered, when assets are considered for disposal, when new regulations are considered, and when major procurement decisions are made.
The British Department for Transport has developed a comprehensive approach to evaluating projects and documenting their value for money based on the underlying government approach described in the Green Book. The principal aim is to ensure that value for money is achieved and that the department's chief accounting officer can document projects' justification when required by Parliament. Department for Transport officials said they use their benefit-cost program to advise ministers on the expected impacts of proposals, support planning staff decisions, and explain to the public about the benefits and impacts of projects and programs.
The Department for Transport evaluates projects on a cost-benefit basis rather than a cost-effectiveness basis. The cost-benefit process quantifies in monetary terms as many of the costs and benefits of a proposal as possible, including items for which the market does not provide prices. These include the cost of a ton of carbon emissions or the value of time. In a cost-effectiveness evaluation, an analysis includes only the costs of alternative ways to provide the project or service. The value of many externalities is not included.
The British transport benefit-cost system compares projects or programs to a no-build or no-action scenario (figure 12). Its analysis assumes that in an increasingly populated world that congestion and its associated costs of delay, emissions, and crashes would increase in the no-build case. Therefore, the costs and benefits of a project are compared not just to the current base case of conditions, but also to a future no-build case in which congestion and its impacts are higher. The British analysis seeks to evaluate if net social welfare would be greater with the investment than without it. The Department for Transport evaluates projects on a 60-year horizon with a 3.5 percent discount rate.
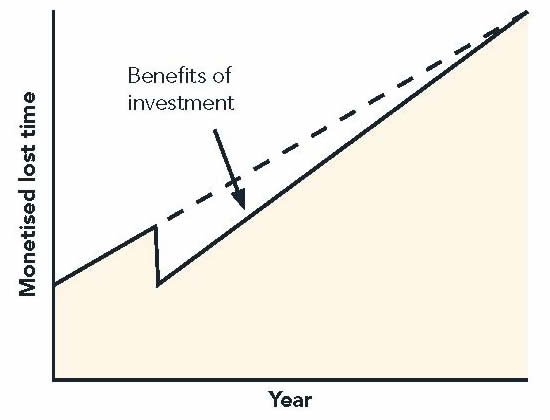
Figure 12. A project's congestion benefits are compared to a no-build scenario.
Among the values that are monetized when evaluating projects are risk of death and injury, noise, carbon emissions, physical fitness of residents if they increase their amount of walking, travel time savings, operating costs of the facility, private sector impacts, and the costs to government. Other factors for which a qualitative value is applied include the effects of visual intrusion on a community, aquatic impacts, social inclusion, biodiversity, and effects on historical facilities or geographic context. With the other nonmonetized values, Department for Transport officials create an adjusted benefit-cost ratio, which is not as economically robust but captures a wider array of impacts and considerations.
Department for Transport officials use the findings to make value-for-money reports that can assess a project or program by the following:Projects are grouped by their relative merits, with projects with benefit-cost ratios of 1.0 or less rated as poor, above 2 as high, and above 4 as very high. With such rankings, officials can document that up to 95 percent of projects the department selected were in the high or very high value-for-money category.
Queensland Department of Transport and Main Roads officials demonstrated how they use benefit-cost rankings to prioritize arrays of strategies. They rank ordered a large number of safety countermeasures by their benefit-cost ratios. Strategies as diverse as increased speed enforcement, increased driver education, and engineering improvements were evaluated based on international studies of their effectiveness. A Pareto analysis was conducted to determine which small percentage of roadway conditions create a disproportionate percentage of crashes. From those two analyses, the most effective strategies to address the crashes were estimated by rank order of cost-effectiveness. The most cost-effective was an increase in police presence combined with speed cameras, which produced a 65:1 benefit-cost ratio.
NZTA conducted a periodic baseline review of the benefits of enforcement services that could lead to increased investment. An additional 337,000 road-policing hours were added when the benefit-cost analysis showed it would provide an 8:1 return (with no diminishing returns.) The benefit-cost ratio of targeted onroad enforcement, speed cameras, and safety advertising has shown benefits of up to 28:1.
Officials in these agencies said they use such analyses to explain their decisions to the public, media, and legislators. "We get tremendous scrutiny on what we are investing in. The dollar we spent could be spent on some other public good. So we find ourselves being more thorough on analyzing and explaining how we spend that dollar," said a Queensland official.
Despite the widespread use of benefit-cost analysis, the benefit-cost ratio was often not the only criterion used in project selection. Officials said policy considerations, social objectives, and environmental considerations often were key factors in decisionmaking. For instance, New Zealand officials said that if their passenger rail investments were made solely on benefit-cost ratios, the level of passenger rail spending might be reduced. However, society expects an adequate level of transit service, which the government desires to meet. In addition, the seven Roads of National Significance were not selected as a result of a benefit-cost analysis, but as a result of a policy-driven initiative to improve the economy and make the country more competitive. The New Zealand Investment and Revenue Strategy assigns a profile to every transport product, giving a high, medium, or low rating for each of the three criteria: strategic fit, effectiveness, and efficiency.
The amount to be spent on the massive Nation Building Program in Australia was not calibrated based on an economic analysis of benefits and costs. However, the benefit-cost ratios of individual projects will be a factor in selecting and ranking the projects proposed for funding.
Although the officials interviewed were adherents of benefit-cost analysis for projects, all acknowledged that it may not capture all considerations of a project and that their governments often considered noneconomic factors in their final decisions.
The concept of risk appeared to be emerging rapidly among the agencies that sought to demonstrate the financial prudence of their actions. By managing risk, they could more intelligently invest scarce resources among many competing investment needs.
For example, the concept of risk management permeated the New South Wales RTA. Risk was discussed in virtually every decision area of the organization, from how it tests and licenses young, at-risk drivers to how it selects locations for guardrails, performs maintenance on steep slopes, and measures the risks of reusing treated timber pilings. A perusal of the agency's financial statements, annual reports, and oversight documents revealed that managing risks and making rational tradeoffs between the degree of risk and the subsequent level of investment were widespread across many disciplines.
The New South Wales Total Asset Management Manual describes risk management as a systematic process to identify risks that may impact the organization's objectives, analyze their consequences, and develop ongoing measures to treat them. It says risk management is essential at any stage of the asset life cycle when a significant decision must be made. The risks associated with the decision and their implications should be weighed with other factors when determining a course of action. It requires that risk management be formally applied throughout the total asset management process when setting strategic directions, developing or evaluating projects and programs, and entering into contracts with the private sector.
The New South Wales RTA annual report acknowledged that it faces considerable challenges and risks in managing its large bridge and road networks. The number and cost of high-volume, aging pavements with undetermined remaining service lives was one form of risk mentioned in the report. A key challenge in managing these pavements is to accurately forecast the structural conditions and their subsequent remaining useful life. To reduce risk, the department captures the results of research projects to more accurately predict the structural integrity of the pavement and better identify which high-volume pavements are at high risk of eventual failure. Those pavements are scheduled for rehabilitation or replacement.
On lower volume pavements, another aspect of risk management and pavement decisionmaking was to give priority treatment to weaker and more water-sensitive rural granular pavements over urban arterial asphalt roads, which are more resilient to rainfall. The urban arterial roads are typically lower speed roads and represent less risk to road safety caused by surface roughness than the higher speed rural routes. The risk-mitigation approach has resulted in acceptable levels of service on both the rural and urban network and reduced risk on the crash-prone, higher speed rural routes.
The department's infrastructure maintenance program establishes priorities on a risk basis to protect assets and safeguard motorists. A strategic risk-based approach is taken to maintenance to determine minimum levels of service and ensure consistent requirements for identifying and rectifying defects. The bridge management approach prioritizes investments by historical failure rates for specific elements of bridges based on bridge age and bridge design (figure 13). The department realized that pre-1948 bridges lack sufficient live load safety factors, so it prioritized those bridges for corrective treatment. Likewise, it identified a list of high-risk slopes on the state network for inspection and treatment.
In driver licensing and vehicle inspection, the consideration of risk was highly evident. A Novice Driver Pilot Program was begun as an AUD10 million education program to reduce the number of young driver deaths on state roads. The trial was a joint effort by RTA, the Australian and Victorian governments, and the Federal Chamber of Automotive Industries. The training will provide young, provisional drivers with an understanding of their limitations and how they can reduce the risks they face on the road.
A vehicle selection matrix is used as a risk-based procedure for identifying and inspecting heavy vehicles. It improves the intercept rate of high-risk vehicles through a screening process to identify vehicles with historically poor compliance rates. It has been deployed at checking stations to reduce the intercepts of low-risk vehicles and to focus inspection activities on higher risk vehicles and operators.
In 2006, the department began an environmental risk assessment of the reuse of treated bridge timbers. The timbers had not been reused because of concerns about surface treatment chemicals. Depending on the outcome of the risk assessment, the department will conduct a trial timber reuse program. Also, in the environmental area it adopted a risk assessment process for identifying construction projects with a propensity for significant sedimentation runoff.
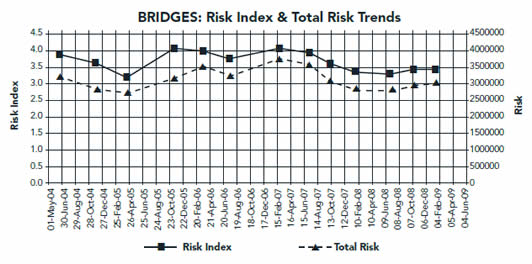
Figure 13. Queensland officials track the overall risk to their bridge inventory as an ongoing metric in their reporting processes.
| << Previous | Contents | Next >> |

