U.S. Department of Transportation
Federal Highway Administration
1200 New Jersey Avenue, SE
Washington, DC 20590
202-366-4000
Chinese officials at all levels of government and in the private sector agree that investing in the transportation system is one of the country's most important investment priorities. Not only does a reliable and efficient transportation system support economic development, but it also provides mobility for an increasingly mobile Chinese population.
Figure 5 shows the level of investment that has occurred since 2000 in different elements of the transportation system and the expected level of investment up to 2010, in U.S. dollars. Figure 6 shows the extent of four transportation networks in terms of network expansion.
The investment strategy in each modal network is very different, including who is involved, what type of investment is being contemplated, and the expected role each modal network is to play in the overall transportation system. Each modal network will be discussed in the following sections.
Figure 5. Average annual total investment in Chinese transportation infrastructure (US$).
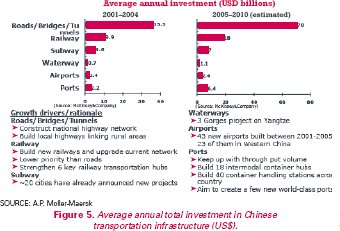
Source: A.P. Moller-Maersk
Of all the transportation investments made in China over the past 5 years, the largest amount has been dedicated to the nation's road network. In fact, the pace of investment has been so fast over the past 5 years that any comparison with years before this does not provide a good picture of what is happening with road investment today. Table 3 presents some of the most important characteristics of China's road network. As the table shows, the growth rate in both network expansion and network use has been substantial.
According to the Ministry of Communications, the total highway investment in 2006 was US$84.3 billion, a 13.6 percent increase over the 2005 investment level. Domestic loans (from the China Development Bank) and self-finance bonding accounted for the bulk of the revenue for this investment program, 40.7 percent and 32.8 percent, respectively, of the funding. Only 1.5 percent of the capital investment came from the national government budget.
The government has plans to expand the national expressway system, as shown in figure 7. By 2010, the expressway system is expected to be 65,000 km (40,389 mi) long; by 2025, the total expressway network is expected to be 85,000 km (52,800 mi). This expressway network is designed to have seven major expressways radiating out of Beijing, nine north-south expressways, and 18 east-west expressways (the so-called 7-9-18 plan). This network is intended to link most cities with a population of more than 500,000. In addition, expressway extensions into the western provinces are aimed at increasing economic opportunity in this part of the country.
Figure 6. Growth and expected growth in Chinese transportation infrastructure.
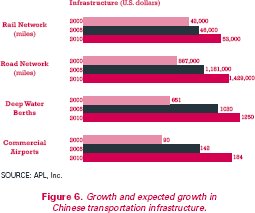
Source: APL, Inc.
To a large extent, this expressway network is modeled after the U.S. Interstate network, with similar geometric designs and operational characteristics. Also similar to U.S. expressways, the urban portions of this network are severely congested during peak periods.
Transportation officials and U.S. shippers pointed to overweight trucks as one of the most important challenges facing Chinese transportation agencies. Given that the trucking industry consists primarily of numerous one- to three-truck firms, many markets are highly competitive. In addition, Chinese manufacturers have the right to choose the carrier for the first move from the plant, which provides a strong incentive to load a truck as much as possible to maximize revenue. The national, provincial, and municipal governments have established enforcement programs, but the sense among transportation officials is that a large number of oversized and overweight trucks are still on the road.
| Characteristic | 2005 | 2006 | % change |
|---|---|---|---|
| Total road mileage (miles) | 2,078,603 | 2,148,080 | 3.3 |
| Expressway (miles) | 25,479 | 28,172 | 10.6 |
| Freight tonnage by highway (100 million tons) | 134.2 | 146.6 | 9.3 |
| Freight ton-miles (100 million ton-miles) | 5,401 | 6,061 | 12.2 |
| TEUs carried by truck | 24,649.224 | 35,178,263 | 42.7 |
Source: Ministry of Communications, Transport Statistics Yearbook, 2006
Chinese officials realize that the rail network needs to be improved if it is to play an important role in international trade. Figure 8 shows the major rail lines in China. Similar to the national expressway network, China plans to add to this network to create an 84,973-km (52,800-mi) main rail network by 2010 and a 100,000-km (62,137-mi) network by 2025. The current 5-year plan targeted the following rail investments:
Container movements by rail face several challenges. Container movement on the rail network carries about 2.2 percent of the national rail freight tonnage and 1.5 percent of the total container volume moved in the country. Three types of rail intermodal services are available: scheduled, unscheduled, and block trains. Scheduled and unscheduled trains have the least priority on the rail network, with military, passenger, coal, and foodstuffs coming first (the rail network is shared by freight and passenger rail services). Freight movements by rail are often unreliable and, in many markets, face stiff competition from trucking firms. Few ports have dockside rail access, so some form of intermodal transfer must occur before containers reach the port that enables them to be loaded onto a ship.
Figure 7. China's major highway network.
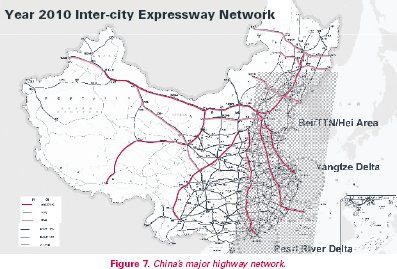
Figure 8. China's rail network.
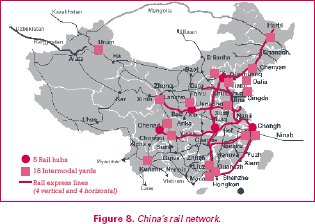
China plans to invest in the freight rail network with expectations that more freight (especially containers) will be hauled by rail. A 10 million 20-foot equivalent unit (TEU) target via rail has been established as part of the 5-year planning process. Given that the level is now 3 million TEUs, this is an ambitious goal. Eighteen new intermodal yards are part of the strategy to attract more container traffic to rail. Several of these yards are open and others are under construction. New freight-only track is being constructed in major origin-destination corridors and investments are being made in rolling stock. However, unlike many of the major road projects, private investors have not actively sought investment opportunities in the rail network. Government solicitations to participate in some of the intermodal rail yard projects, for example, did not attract much attention from the investment community.
Throughout China's history, rivers and coastal shipping routes have been major thoroughfares for commerce. The Pearl and Yangtze Rivers, in particular, have served as the commercial arteries for much of China's economic development. As noted earlier, the Pearl River Delta was the first region to experience large-scale foreign investment, becoming a major manufacturing and transportation hub of China's international trade.
Table 4 shows statistics on the importance of China's navigable water network. These statistics are national and thus hide the more local nature of barge transportation. For example, about 30 percent of the transshipments that occur in Shanghai involve barges. In the Pearl River Delta, the percentage is slightly higher. The exact percentage in the Pearl River Delta is hard to estimate because many transshipments occur in midstream from one barge to another to avoid terminal fees. Also, some terminals have limited barge access because of capacity constraints, so barges must have a minimum of six containers to berth pier-side.
Those interviewed for the scanning study had different opinions about the Pearl and Yangtze River barge operations. The sense was that too much barge capacity exists in the Yangtze River market and, given the numerous small operators (similar to the trucking industry), it is a highly competitive market. In some cases, the freight forwarder is also the barge operator, which results in a mixing of interests on expediting the movement of the container. Few berths are available for barges along the river and at the mainland port itself (this is not true for the new port built off the coast). In addition, the recent opening of a new port in Shanghai (Yangshan) many miles from the old port and located in deep water raises questions about the seaworthiness of the existing barge fleet to serve the new port.
For the Pearl River, the sense was that barge capacity is sufficient to handle market demand, although competition is still quite high, in this case among larger barge companies. New river ports have been constructed in the Pearl River to cater to barge traffic, thus providing more convenient intermodal transfer (although a large percentage of the transshipments occur midstream).
Table 5 indicates why inland water transportation is so important for the supply chain in China. This table shows estimated costs and transit time to move a 20-foot container from Chongqing to Shanghai, a distance of 2,092 to 2,575 km (1,300 to 1,600 mi), depending on the modal network (see map in figure 8 for the location of Chongqing). Although barge transport takes a longer transit time than truck, it costs almost 80 percent less. For commodities that are not time sensitive, barge transportation is clearly the preferred mode on the basis of cost.
The economic growth that China has experienced over the past two decades has been driven primarily by international trade. This trade could not have occurred without port capacity to handle the ever-increasing flow of containers coming from mainland factories. Figure 9 shows TEU movement for selected Chinese ports in 2006 and that expected in 2011. Growth in these ports has averaged greater than 20 percent per annum over the past 5 years, so the forecasted volumes do not appear unreasonable. Figure 10 shows a comparison between TEU throughput in Chinese and U.S. ports. Figure 11 shows the expected growth in China container movements as a share of the global market, from a 31 percent share in 2006 to an expected 34 percent share by 2011. Ten of the top 30 container ports are located in China, as are three of the top four (Hong Kong, Shenzhen, and Shanghai). By 2010, eight of the top 15 container ports will be in China, with Shanghai expected to be the largest container port in the world.
Figure 9. TEU throughput in selected Chinese ports, 2006 and 2011.
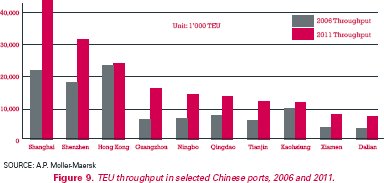
Source: A.P. Moller-Maersk
Figure 10. TEU throughput in Chinese and U.S. ports, 2006.
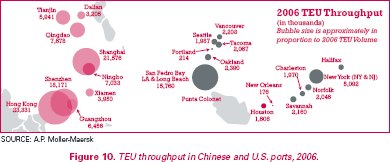
Source: A.P. Moller-Maersk
Figure 11. Expected Chinese share of global container market.
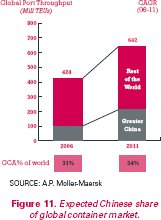
Source: A.P. Moller-Maersk
The ports in Shanghai, in particular, play a significant role both in the Chinese economy and the global market. Tonnage through the ports in Shanghai will exceed 350 million in 2007, making it the largest port in the world from the perspective of tonnage moved. Shanghai has already overtaken Hong Kong as the largest container port in China (an expected 27 million TEUs in 2007), and expected future growth will only solidify this position.
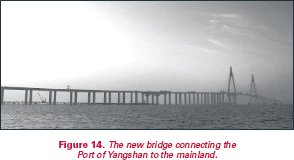
The new Shanghai Port of Yangshan is an example of the type of investment the Chinese are making in port infrastructure (see figures 12 and 13). The first two phases of the US$14.5 billion Yangshan deep-sea port are now open, with a 2020 target year for achieving the full capacity of the port (33 to 50 deep-sea berths) at 25 million TEUs per year. The port is located about 32 km (20 miles) offshore and is connected to the mainland by a highway bridge (there is no direct rail connection to the port, although there is a new intermodal rail yard on the mainland near the bridge gateway).
Figure 12. Many container transshipments in the Pearl River basin take place in midstream, primarily to avoid fees for land terminal use.
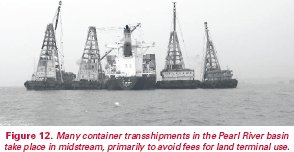
Figure 13. The new Yangshan deep-sea port in Shanghai.
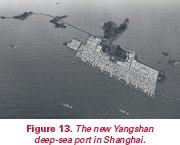
Figure 14. The new bridge connecting the Port of Yangshan to the mainland.
One of the most impressive aspects of the Yangshan Port, and indeed other Chinese ports, is its operational productivity. The terminal can handle 35 TEU operations per hour per crane, with a daily throughput record of 23,044 TEUs. The terminal is open 7 days a week, 365 days a year. The terminal operator commits to loading and unloading a barge within 5 hours and a vessel within 20 hours, and it has a posted truck turn time of a maximum 30 minutes. Some ports can use seven cranes per vessel in the loading and unloading process, greatly speeding up the vessel turnaround time.
The Yangshan Port has not only created a modern facility to export goods to the world, but it has also spurred local growth. For example, the mainland entry to the port bridge has become a highly desirable location for logistics and warehousing centers. A new town has been created to house port employees, and what was once agricultural land is turning into manufacturing, freight consolidation, and warehousing sites.
The scan team met with many representatives of U.S. retailers and shipping, warehousing, and consolidation firms. Many of these discussions focused on their perceptions of the performance of the U.S. transportation system as much as on the Chinese transport system. The major point the private sector participants in these meetings made is that they have every expectation that the Chinese government, along with private investors, will provide a transportation system that will meet the needs of the supply chain in China. Their concern is more with the ability of the United States and European Union to provide reliable transportation serving their own ports. Much of the discussion centered on the poor productivity of U.S. port operations compared to Chinese ports.
Several companies provided the scan team with estimates of future trade trends. Firms such as ProLogis, Moller-Maersk, and American Presidents Line made several observations that they believe characterize the current and expected market situation in China. The following is a compilation of their observations:
The city and Port of Qingdao, located in the province of Shandung on the Yellow River, has been one of the fastest growing economic centers in China. GDP growth in the province has averaged just over 16 percent a year for the past 3 years, with growth in foreign direct investment averaging just over 13 percent a year. The Port of Qingdao has been one of the fastest growing ports in China. Port officials expected about 9 million TEUs to move through the port in 2007. The United States has the highest number of container exports (19 percent), but Japan (18 percent) and South Korea (14 percent) are just behind. The European Union represents 17 percent of port exports.
The port used to be located in center city, some 80 km (50 mi) away. However, because of community concerns about port expansion so close to neighborhoods, government officials decided that a new port should be constructed some distance away. A toll road was built to connect to the new port. Qingdao is one of six cities in China that has been given planning authority by the central government, so it has been able to develop an economic development strategy that emphasizes the competitive advantages of the surrounding region.
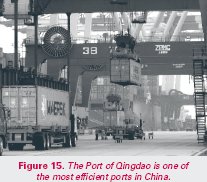
The port itself is one of most modern in China. It has ondock rail facilities (one of the few in China that does), as well as barge transshipment terminals. The major terminal in the port, the QQCT terminal, is a joint venture of four shareholders—a government corporation (31 percent share), Dubai Ports (29 percent), Maersk (20 percent), and Cosco Pacific (20 percent). Just over US$880 million has been invested in the terminal to date. Terminal operations include the monitoring of key performance measures, such as gross crane rate (36.6 moves per hour), gross vessel rate (69 hours), net crane rate (40.8 moves per hour), and truck turnaround time (34 minutes).
Figure 15. The Port of Qingdao is one of the most efficient ports in China.
Many other private company participants echoed the observations made by these three companies. Economic growth is expected to continue at high rates. The Chinese government is investing heavily in transportation infrastructure and is slowly opening the transport sector to foreign investment. There are areas of concern for the Chinese transportation system (e.g., the freight rail network), but generally most believed that transportation to and from the ports will not be a big issue in the future, although lowering the cost of logistics will be a major focus of both public and private organizations.
| Characteristic | 2005 | 2006 | % change |
|---|---|---|---|
| Total navigable mileage (miles) | — | 76,639 | — |
| Inland river berths | — | 30,942 | — |
| Coastal port berths | 4,298 | 4,511 | 5.0 |
| Number of barges | 41,000 | 37,000 | -9.8 |
| Fleet net dead weight (million tons) | 11.0 | 12.0 | 9.0 |
Tonnage by waterway (billion tons)
|
2.2
|
2.5
|
13.2
|
Ton-miles (100 million ton-miles)
|
30,865
|
34,477
|
11.7
|
| TEUs carried by water | 19,400,000 | 23,300,000 | 20.21 |
Source: Ministry of Communications, Transport Statistics Yearbook, 2006
| Chongqing to Shanghai | Distance (Miles) | Transit Time (Days) | Cost (US$, 20-ft container) |
|---|---|---|---|
| Road | 1,300 | 3–4 (40 hours) | $1,500 |
| Rail | 1,600 | 7–10 | $ 540 |
| Barge | 1,500 | 8 (11 upriver) | $ 315 |
Source: APL, Inc.
The most important criterion for investment is that a port is in the government's plan for expansion and improvement. Once this prerequisite is satisfied, the following criteria are important:
ProLogis is the world's largest owner, manager, and developer of distribution facilities, with 44.9 million square meters (483 million square feet) of industrial space in 105 markets across North America, Asia, and Europe. The company leases its industrial facilities to 4,700 customers, including manufacturers, retailers, transportation companies, third-party logistics providers, and other enterprises with large-scale distribution needs. Since going public in 1994, ProLogis has experienced extraordinary growth. It has gone from $400 million in assets under management in just nine U.S. States to a global portfolio of properties valued at more than $34 billion. ProLogis continues to follow its customers into new markets and to extend its position as the global leader in industrial real estate.
ProLogis identified China as a major market several years ago and now has facilities in 19 markets in the country. ProLogis has also been a major player in developing the Lingang industrial park near the new Yangshan Port. The Lingang industrial area is expected to be about 300 square km (116 square mi) in area (half the size of Singapore), with land uses targeted for manufacturing, heavy industry, high tech, logistics, and residential and commercial activities. The 2020 population is expected to reach 800,000.
The ProLogis facility in Lingang, a joint venture with a state-owned agency, has an area of about 2.8 square km (1.1 square mi) and currently has 15 acres of warehousing floorspace and just over 52 acres for a container yard. At build out, this facility is expected to have about 1.4 million square meters (15 million square feet) of usable space.
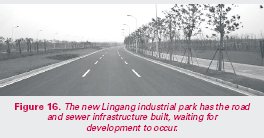
Investment in the ProLogis facility was based on expectations that the new Yangshan Port will generate large demands for both bonded and nonbonded warehousing and containerhandling facilities. The local government invested in the local road infrastructure with the expectation that development would occur at some future point.
Figure 16. The new Lingang industrial park has the road and sewer infrastructure built, waiting for development to occur.
| << Previous | Contents | Next >> |

