U.S. Department of Transportation
Federal Highway Administration
1200 New Jersey Avenue, SE
Washington, DC 20590
202-366-4000
Japan is a very populous country (127 million people) with much of the population concentrated in coastal cities. Because the country is highly urbanized, the scan team was particularly interested in performance measures that related to the urban character of the communities in which transportation facilities are built and operated. In addition, Japan is known for its leading-edge application of technology in all aspects of daily life, so the team was interested in identifying how the Japanese use intelligent transportation system ( ITS ) technologies to collect data for its performance management efforts. The Japanese government adopted a performance-based planning approach to infrastructure decisions just a few years ago, so the team also wanted to see how fast the Japanese had implemented the approach and what they had learned from this experience.
Governmental Context
Japan is a parliamentary democracy with a Prime Minister selected from the majority (or coalition) party. The Prime Minister selects the Cabinet. In transportation, the primary national government agency for transportation is the Ministry of Land, Infrastructure, and Transportation ( MLIT ) . Formerly separate agencies, MLIT consists of 13 bureaus plus the Minister's secretariat. In transportation, the key bureaus are the Road, Railway, Road Transport, Maritime, Ports and Harbors, and Civil Aviation Bureaus. In addition, MLIT has nine Regional Development Bureaus, which plan and manage roads and interact with 47 prefectures (or states).
The scan team spent most of its time with officials of the Road Bureau, an agency of 212 employees with primary responsibility for the nation's road system. The Road Bureau has eight regional offices. A National Institute for Land and Infrastructure Management, MLIT 's research arm, has also been established to conduct research on leading- edge applications of technology and urban infrastructure issues. In addition, a semi- independent Institute for Traffic Accident Research and Data Analysis, jointly controlled by MLIT and the National Policy Agency, has been created to provide a central capability for crash assessment.
In addition to the Road Bureau, Japan has created metropolitan and national toll agencies, including the Metropolitan Expressway Public Corporation and the Japan Highway Public Corporation. The government is considering privatizing the toll roads in Japan. The most important high- capacity, high- speed roads in Japan are the responsibility of these toll agencies, under the supervision of the Road Bureau.
Use of Performance Measures
The Japanese government has been shifting to a performance- oriented focus over the past several years. A 2002 national law on policy evaluation and program performance required that government ministries adopt such a focus in their activities. The road-oriented recommendations made by a Cabinet- level Infrastructure Development Council in 2002 that came from this law were the following:
MLIT has followed a performance management scheme since its creation in 2001. Performance measurement is considered part of a policy evaluation system consisting of policy assessment, performance measurement, and program evaluation established in response to the 2002 law (see figure 3). Policy assessment—what would be called policy analysis in the United States—is a systematic consideration of the consequences of alternative policy choices in relation to stated goals and objectives. Program evaluation focuses on ex post facto assessment of program outcomes with special focus on understanding the cause- and- effect dynamics that led to these outcomes. Performance measurement consists of monitoring transportation system and organizational performance in relation to a set of politically defined and publicly reviewed performance indicators.
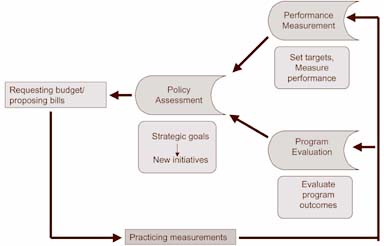
Figure 3. Performance management in the Ministry of Land, Infrastructure, and Transportation in Japan.
A major legislative mandate that has strongly influenced the development of MLIT performance indicators occurred in 2003 when the Japanese Diet (Parliament) passed the "Law for the Long- Term Plan on the Main Development of Social Infrastructure." This law required the government to establish a plan for achieving performance targets in several infrastructure areas, including roads, railroads, ports, navigation channels, and actions relating to flood control and coastal conservation. The MLIT plan, based on indicators listed in the law, included 116 performance indicators, many with targets defined in cooperation with other ministries, including the Ministry of Finance. Long- term targets were established for 2020 and intermediate targets for 2007. A Performance Management Office was created in the Road Bureau in 2003 as a center of responsibility for performance measurement.
The Road Bureau developed a strategy for incorporating an outcome- based road administration decision making framework into the strategic and operational decisions of the agency. A set of 17 core indicators relating to five policy themes was defined. Regional performance- based plans for each prefecture were to be formulated by MLIT 's local National Highway Offices in cooperation with prefecture officials, using selected indicators from these 17 core indicators, along with any others specific to their needs. By March 2004, 31 of 47 prefectures had established their own performance indicators, including 80 measures different from the national indicators. The 17 core indicators are shown in table 4.
Several performance indicators in table 4 are of special note. The "percentage of electronic toll collection ( ETC ) use on the expressway system" represents an MLIT commitment to advance the use of technology in making network operations more efficient. (Note that this indicator is found in the economic vitality policy category). Also related to network efficiency is the "percentage of targeted traffic flows that diverted to the expressway network from currently used non- expressway roads" indicator. The quality of life indicators include the "percentage of barrier- free road near transit terminals" and the "percentage of main roads in urban areas without utility poles." Both measures were unique to Japan and reflect the importance the Japanese place on walking as a mode of transportation and on community aesthetics. The "percentage of cities having evacuation routes" is not surprising, given the risk from natural disasters in Japan. In the environmental category, the "percent compliance with nighttime noise standards" also reflects the highly urban nature of the country.
Although the scan team did not have the opportunity to review all of the prefecture-specific performance plans, it saw examples of the types of measures that have surfaced from these efforts, including the following topics of interest to the scan team:
| Performance Topic | Jurisdiction |
|---|---|
| Road sections with winter- related speed reductions |
Yamagata Prefecture |
| Snow removal from roads in school zones |
Aomori Prefecture |
| Population access within 60 minutes of advanced hospitals for newborn babies |
Aomori Prefecture |
| Safe passing areas on highways and local roads for motor vehicles and pedestrians |
Niigata Prefecture |
| Sidewalks with sufficient width |
Toyama Prefecture |
| Existence of green space in road right- of- way |
Niigata Prefecture |
Each performance measure in a prefecture's performance plan has established targets and a list of projects to be undertaken in the coming year related to these targets.
To ensure consistent implementation of the performance measurement concept nationally, the Road Bureau holds annual meetings with its regional offices. These meetings focus on the performance of the road network, detailed analysis of key road facilities, the status of current projects, and the reporting of outcomes of implemented projects.
The original law on administrative reform required the results of performance evaluation to influence budget allocation. It is too early in the process for identifiable changes in the budget process to have occurred, but the Road Bureau has changed its budgeting format from requests for specific road types to requests for outcome categories. An illustrative budget was shown to the scan team that divided the budget into categories on congestion relief, regional collaboration, maintenance and repair, environmental mitigation, safety, and utility relocations. The budget requested for 2004 showed increases for environmental mitigation, safety, and utility location efforts, and decreases for the other three categories.
Congestion
With a population of 127 million people primarily located in coastal cities, it is not surprising that traffic congestion is a major issue in Japan. It was estimated in 2003 that 3.8 billion person- hours per year are lost because congestion, about 30 hours per person per year. Of this national total, one- third occurs in the Tokyo metropolitan area (or what is referred to as the Kanto Regional Development District of the Road Bureau). The Tokyo major road network is primarily oriented radially into the downtown, with several circumferential or ring roads either completed, under construction, or in the planning stage. It was apparent from discussions with Bureau officials that they consider completion of the freeway network, especially the ring roads, a critical element of the region's strategy to reduce congestion.
As shown in table 4, the key congestion measure is "time loss due to congestion," measured in million person- hours per year. The current value for the monitored sections in the Kanto region is 610 million person- hours, and a target value of 530 million person- hours has been established for 2007. It was not clear whether this target was referenced to current values of congestion or whether natural growth in traffic volumes was also assumed as part of the reduction. Some officials suggested that the target takes traffic growth into account, which makes it even more ambitious.
Data collection necessary to estimate this congestion measure includes traditional roadside surveys (23,000 locations in Japan) , automated traffic counters, ultrasonic loop detectors at 500 locations to detect travel speed, use of the floating car method along 33,700 sections to determine travel speed, and an evolving program to use probe vehicles for determining travel time. Japan has about 5,000 probe vehicles (3,000 in Tokyo) , most of which are buses. Through the use of global positioning system ( GPS ) satellites, the progress of buses through the arterial road network can be monitored and reported to a central database server. This data can be turned into several important pieces of information—real- time arrival information for transit riders, operations control for bus managers, and road system management and performance measurement for the Road Bureau. In addition, probe data have been used to evaluate the impact of network expansion on congestion.
Figure 4a shows an example of how this information is portrayed for one of the ring roads circumventing central Tokyo. Figure 4b shows the use of this information to monitor sections of an individual arterial route.
Figure 4. Visualization of performance data in Japan.
Figure 4a. Congestion on a belt way in Tokyo.
Figure 4b Congestion on an urban arterial.
One of the most important providers of road service in the Tokyo metropolitan area is the Metropolitan Expressway Public Corporation ( MEX ) , formed in 1959 to improve traffic flow in the region. Tokyo now has 281 km ( 175 mi) of tolled expressways carrying about 30 percent of all arterial traffic and 35 percent of truck volumes in the metropolitan area. About one- third of toll receipts go to pay for new road construction, 37 percent to interest on outstanding bonds, and 30 percent to ongoing road management.
MEX has estimated that 86 percent of expressway congestion is caused simply by lack of road capacity, 12 percent by crashes and breakdowns, and 2 percent by road maintenance and repair. This estimate has led to some unsurprising surprising proposed solutions. Most importantly, expansion of the expressway network, especially the ring roads, has become a key part of the road agencies' strategy. The most recent report for MEX identifies just over 32 km (20 mi) under construction. Road Bureau officials consider a proposed 86- km (53.4- mi) Tokyo Outer Ring Road, located about 15 km (9.3 mi) from downtown, the important missing link in the regional expressway network, but construction has been delayed by public opposition to the disruption that would occur in the neighborhoods through which it passes. The proposal is to build much of the road in tunnel sections, costing more than US$1 billion per kilometer. At this point, a finance plan for this road has not been developed.
Another ring road, the Metropolitan Intercity Expressway, about 40 to 60 km (24.9 to 37.3 mi) from downtown, is also under consideration. This project is being delayed by difficulties in obtaining right- of- way.
Besides constructing new expressways, MEX is widening lanes, building new ramps to remove bottlenecks, and closing ramps when circumstances require it. Because 30 percent of the congestion on the national toll road network occurs at tollbooths, MEX also is encouraging road users to adopt ETC technology.
Congestion from road maintenance work is mitigated through contract specifications on time and location of the work, advance release of public information, and in- vehicle traveler information systems.
MEX uses several performance indicators to measure service delivery, including the following:
| Indicator | Target |
|---|---|
| Average speed |
44 km/ h (27.3 mi/ h) daytime |
| Duration of congestion |
<363 kilometer- hours/ day (226 mile- hours/ day) |
| Number of crashes |
<13,000 per year |
| Average recovery time for crash |
<60 minutes |
| ETC use |
>20 percent |
| Customer satisfaction |
>3.0 out of 5.0 |
Safety
Traffic safety has been a social concern in Japan for several decades. From 1960 to 1970, when the number of automobiles owned in Japan increased twenty fold, annual traffic fatalities increased from 6,379 to 16,765. Even worse, the number of people injured increased from 76,000 to 981,000 over the same period. With the implementation of a variety of safety measures, fatalities have declined dramatically since 1970. MLIT officials are concerned, however, because the number of traffic- related injuries increased to an estimated 1,168,000 in 2002. One important aspect of this safety record is the percentage of crashes involving pedestrians and bicyclists. Close to 40 percent of the fatalities are either pedestrians or bicyclists, 60 percent are elderly, and 60 percent occur within 500 meters (1,640 feet) of home.
As seen in table 4, several of the core 17 performance indicators relate to safety. Besides those listed in the safety category, MLIT considers measures relating to "barrier- free main roads for pedestrians" and the "percentage of roads without utility poles" safety measures as well. Several initiatives have been aimed at each of these measures. From 1996 to 2002, 3,200 locations were identified on trunk roads where at least 24 injury- causing crashes had occurred in four years, where 40 percent of all crashes resulted in fatalities, or where more than two fatalities had occurred in four years. Each location received appropriate measures aimed at reducing crashes. At 1,700 of the locations where treatments had been completed by 1999, the number of traffic-related injury crashes had decreased by 30 percent, even taking into account the growth in traffic volume.
Officials plan to continue this so- called "black spot" removal program in the future. An additional 4,000 locations will be selected where the crash rate is five or more times the average crash rate for that road type. Figure 5 shows how the locations are ranked and intersections selected.
Other initiatives to reduce crashes include removal of illegally parked cars, promotion of safe and barrier- free pedestrian walking areas, and the use of safety reviews by community volunteers to identify unsafe conditions.
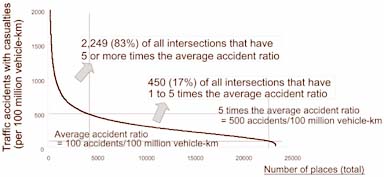
Figure 5. Identification of priority locations for safety countermeasures in Japan.
Urban Design
Community design can be an important element of an overall strategy for meeting many performance measurement goals. For example, urban design in the context of making safer and more walkable neighborhoods is an important initiative for enhancing safety. MLIT participates in large- scale, multi use development projects with a significant transportation component. One project the scan team visited was a redevelopment of Shinjyuku Station, a transit station in the heart of one of Tokyo's largest and most important office and retail clusters. With more than 3.2 million passengers per day using Shinjyuku Station, it has become a major node in Tokyo's transportation system, but one with significant vehicular and pedestrian congestion on the surrounding road network. A narrow sidewalk in front of the station handles more than 430,000 people per day, a challenge that has led to unsafe and severely congested conditions. Given the need to reconstruct a bridge over the commuter rail and subway tracks serving the station, MLIT, local government, neighborhood groups, and railway companies have developed a new intermodal terminal concept that includes significant amounts of mixed- use development. The infrastructure elements of this project are nearing completion, with a new high-rise office complex to follow.
Although the impact and investment magnitude of this project makes it unique, it does illustrate how the national road agency works with a community through the development process to alleviate transportation problems. In such a highly urbanized country as Japan, this linkage between land use/ urban design and transportation investment can be an important tool to help meet transportation goals.
Intelligent Transportation System Technologies
One reason the scan team wanted to visit Japan was to identify how intelligent transportation system ( ITS ) technologies could be used for data collection to support performance measurement. Japan is clearly one of the world leaders in ITS technology development and implementation. MEX uses a surveillance system to monitor road performance and has its own tow truck fleet (privately operated) to respond to incidents. Information is conveyed to road users via graphic information signs, variable message signs, congestion warning boards, local area radio advisories, remote travel kiosks, and in- vehicle navigation systems for motor vehicles so equipped. The data from video cameras and loop detectors is updated every minute. Real- time data is combined with an historical record to predict where congestion is likely to occur in the immediate future. Police agency representatives are located in the traffic management center to coordinate response to an incident. Little of the data collected is archived for planning or system performance management purposes; it is directed primarily to delivering road user information.
The use of electronic toll collection ( ETC ) technologies on the nation's toll expressway network is a key MLIT goal. A national standard has been established for ETC technology, along with a capability to serve multiple communication functions. In February 2004, more than 2.5 million ETC units were in operation.
A dedicated short- range communication ( DSRC ) system has been developed that works in conjunction with ETC technology to allow two-way communication between a vehicle and a central command center. Officials expect this DSRC system to eventually provide up-to-date information to road users on weather conditions, traffic congestion, traffic regulations and controls, and local services, as well as an ability to make reservations at nearby restaurants. In addition, anticipated functionalities include Internet access, parking fee payment (and possibly fuel payment), and guides to local transit services.
One technology in use is the vehicle information and communication system ( VICS ). This system provides drivers with real-time information on traffic conditions. The information is transmitted by a radio beacon, infrared or over FM radio. More than 12 million simple navigation systems are found in the vehicle fleet, and as of June 2003, about 7.2 million VICS units had been sold.
Finally, the Japanese are conducting important research on the development of advanced cruise-assist highway systems ( AHS ). AHS technologies will provide enhanced sensor capability for detecting and responding to obstacles in the road, vehicle control, and monitoring the condition of the road surface. The goal in the use of AHS technologies is to reduce crashes by 50 percent.
The Japanese appear to be in the early stages of thinking about how data collected from ITS technologies could be used to support system performance measurement. The use of probe vehicles for congestion measurement is the most advanced use of such technologies for this purpose. Those involved with developing ITS applications believe they are ideally suited to support a system performance-monitoring concept, as long as the number of measures is limited. The Japanese are also in the early stages of looking at vehicle-to-vehicle communication applications that would allow every instrumented vehicle to serve as a vehicle probe. With the heavy investment in fixed sensors, however, the strategy seems to be to rely on the existing infrastructure for data collection in the foreseeable future.
Observations
Some of the more important observations resulting from the team's visit to Japan are as follows:
| "Just by collecting data, we do not solve problems." —Ministry of Land, Infrastructure, and Transport Official |
.gif)
.jpg)
Figure 6. Determining consequences of project implementation in Japan.
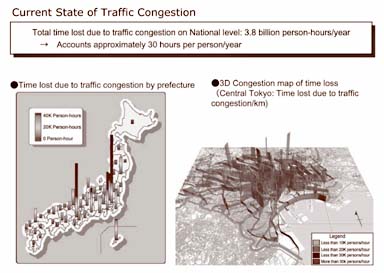
Figure 7. Visualization of network performance data in Japan.
| << Previous | Contents | Next >> |

