U.S. Department of Transportation
Federal Highway Administration
1200 New Jersey Avenue, SE
Washington, DC 20590
202-366-4000
Canada has a long tradition of corporate planning in the governmental sector. From the national government to local municipalities, public agencies have spent considerable time developing approaches to policy formation and implementation that provide a long-term perspective on desired outcomes and on the effectiveness of government programs in achieving these outcomes. In visiting Canada, the scan team was particularly interested in identifying best practices on corporate planning, transportation system performance measurement, and the use of performance measures relating to the linkage between transportation and sustainable development.
Canada is a confederation of member provinces and territories, governed by parliamentary democracy. The Parliament is bicameral, with the Prime Minister choosing the Cabinet from among his own party or from parties in a coalition government. Because of the structure of the national government and of the great distances involved, Canadian provinces tend to be more independent ( and more powerful) than comparable U.S. States. Most service and infrastructure provisionis the responsibility of the provinces (e.g., provincial and local governments are responsible for most of the roads in Canada). The national government is often the vehicle for collecting revenues (e.g., a national gas tax), returning a portion of these revenues to the provinces in the form of transfer payments. Similar to the United States, there appears to be considerable debate about what constitutes a fair return of the revenues collected in the provinces.
Transport Canada, the federal ministry of transport for Canada, is responsible for safe and efficient movement on Canada's rail, marine, road, and air transportation system. It establishes policies and sets standards to achieve this goal. Although at one time responsible for operating Canada's air traffic control system,this system has since been transferred to a nonprofit corporation. Most port sand harbors have also been divested, leaving Transport Canada with little direct operating responsibility. With privatization came a substantial downsizing in staff, resulting in about 4,700 employees working at Transport Canada today. One of the most important legislatively mandated roles for Transport Canada it relates to this scan is its responsibility to monitor and assess the performance of Canada's transportation system.
A National Highway System ( NHS ) serves as the backbone of Canada's road network. Representing 3 percent of total road mileage ( 25,000 kilometers ( km) or 15,535miles (mi)), this system carries 30 percent of all vehicle travel in the country. Transport Canada administers several funding programs that support improvements to the NHS and other critical transportation infrastructure in the country. The Strategic Highway Infrastructure Program ( SHIP ) committed CN$600 million( US$441 million) over the past four years to critical components of the network,with $500 million going to highway construction and $100 million to national system integration. The funds are allocated to the provinces and territories mainly based on population with consideration of other factors, and require a 50-50 match. A CN$600 million ( US$441 million) Border Infrastructure Fund,administered jointly by Transport Canada and Infrastructure Canada, focuses investment on critical border infrastructure and also requires a 50-50 match. Infrastructure Canada provides CN$2 billion ( US$1.47 billion) to support large-scale infrastructure projects done in partnership with provincial, municipal, or territorial governments. This $2 billion Strategic Infrastructure Fund was announced in the 2001 federal budget. An additional $2 billion was set aside for this fund in the 2003 budget. Although regional equity considerations are taken into account,investments will be directed to large-scale projects of national and regional significance. Population is a factor used to determine funding allocations between regions, but not the only factor.
In the 2003 federal budget, a Municipal Rural Infrastructure Fund ( CN$1 billion) was announced. At least 80 percent of the funds are dedicated to municipalities with a population of less than 250,000, and the remaining funds are available to municipalities with greater than 250,000 population. The federal government contributes, on average, one-third of the eligible costs. Provinces and municipalities will contribute the remainder of the cost.
The Canadian government has a few other infrastructure initiatives related to transportation improvements. Eligible projects under these programs include sustainable transportation projects, transit improvements, and road projects. The projects include the following:
Infrastructure Canada Program (CN$2.05 billion, 2000-2007)
Similar to the U.S. Department of Transportation, Transport Canada produces an annual report on national transportation statistics that focuses on trends in the demand, supply, and financing of the transportation system. This report,a parliamentary requirement, not only examines the factors that drive transportation demand ( e.g., national economic performance), but also presents the characteristics of transport system performance by mode. There was a sense among those the scan team interviewed that because much of the data for this report comes from the provinces, and because of the aggregate nature of many of the measures reported on, the annual report does not provide a good picture of Canada's "state of transportation." Officials noted, however, that the annual report often adopts a theme, such as international trade, that is useful for focusing attention on a particular issue.
Transport Canada uses a "results" chain as the underlying logic of its more comprehensive performance measurement efforts. Figure 1 shows such a results chain for the goal of achieving a more sustainable transport network. As shown,individual activities in the organization can be targeted at specific audiences,which then lead to various levels of outcomes. An example of the linkage among strategic objectives, ultimate outcomes, and performance indicators is shown in table 1. Note that this table was prepared by Transport Canada to illustrate the framework being developed.
In 2003, Transport Canada's Corporate Audit and Advisory Services unit reviewed the performance framework established for the agency's sustainable development strategy. This review indicated that 80 percent of the agency's commitments and just over 70 percent of the targets were met or were on track to be met. In addition, this review concluded that the agency's environmental management system ( EMS) was critical to the overall success of improving environmental performance.
Many provincial governments in Canada are in various stages of developing and using a performance-based planning and decision-making framework. A good example is Alberta, where in 1992 a new government instituted dramatic changes in government operations, including the use of outcome-based performance measurement. The Alberta Ministry of Transportation has been a leader in implementing such change( visit Alberta Ministry of Transportationfor its latest annual report and to see how performance is measured). To obtain a more detailed understanding of how a province and a metropolitan area undertake performance measurement, the scan team visited Vancouver, British Columbia.
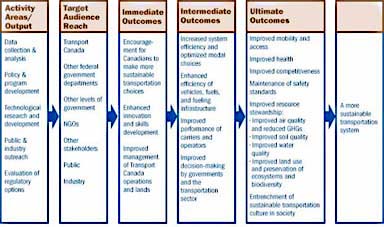
Figure 1.Results chain for Transport Canada.
The scan team met with officials from Transport Canada, the British Columbia Ministry of Transportation, and TransLink, Vancouver's regional transportation agency. To a large extent, the performance management experience in Vancouver and British Columbia is still in a period of development. Both the Ministry of Transport and TransLink have developed a performance-based planning and decision-making accountability system in recent years, and both are still determining how to integrate the system into the decision-making process.
British Columbia Ministry of Transportation
In 2001, the provincial government instituted a policy requiring government ministries to establish "service plans that include measurable performance standards and targets for all programs that are annually audited and published." This requirement was in direct response to a provincial law entitled "Budget Transparency and Accountability Act." The Ministry of Transportation's service plan for fiscal years (FY) 2004/05 and 2006/ 07 was organized by agency goals and core business areas. For each performance measure, a baseline value was identified along with targets for the next three years. The performance measures found in the service plan are shown in table 2.
Several aspects of the performance measurement regimen shown in table 2 merit comment. It is clear from the focus of the performance measurement effort that transportation's role in fostering economic growth is a key policy direction of the ministry, a focus confirmed in conversation with a ministry representative. In this
Source: Transport Canada, Sustainable Development Principles for Transport Canada, Ottawa, Ontario.
regard, the measures relating to "leveraged private investment" and "commercial trucking travel time between economic gateways" stand out because the scan team did not find them at other scan sites. The measures on competitiveness, especially those measuring reduction in legal and regulatory barriers, were also unique compared to those found elsewhere.
Another interesting category of measures related to highways. The reliability measureduration of highway closures longer than 30 minutes-directly linked to the ministry's and police agency's ability to remove incidents from the road network.
The team found the use of customer and employee satisfaction surveys all of the cases it examined during this scan. Of interest in the Ministry of Transport's effort, however, was its attempt to pinpoint those aspects of dissatisfaction that it could address ( e.g., maintenance and snow removal efforts) . More than1,000 surveys were used to establish the baseline satisfaction score ( 6.5 out of 10.0) . The Ministry of Transport has established an FY 2006/ 07 target of8.0 out of 10.0 for this performance measure.
TransLink -The Greater Vancouver Transportation Authority, known as TransLink, was created in 1999 with a mandate to plan, finance, and manage a regional transportation system, including Vancouver's public transit system and major road network. The actual delivery of public transit services takes place through subsidiary companies and contractors, while maintenance and improvement of the major road network is done in partnership with the municipalities. Unlike most such authorities in the United States, TransLink has the ability to assess property taxes, collect tolls, and raise motor vehicle and parking fees to support its programs.
TransLink chose a "balanced scorecard" approach to performance measurement. Based on 1990s research on corporate management, the scorecard was intended to balance the reporting of organizational achievement among financial performance,customer satisfaction, organizational learning and growth, and internal business practices. The scorecard aims to align the strategic directions of an agency with its programs and day-to-day activities. Figure 2 shows where the performance scorecard fits into the decision-making context in TransLink . In this construct,the scorecard consists of the customer, financial, best practices, and employee factors.
According to TransLink officials, the process of developing the scorecard highlighted key themes common to most groups participating in the process. These include the following:
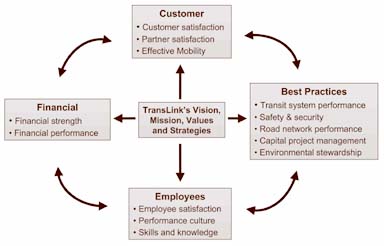
Figure 2.Relationship of performance scorecard factors to TransLink decisions.
The most recent version of TransLink 's performance scorecard is shown in table3.
Congestion
As seen in table 3, a congestion measure is not yet part of the TransLink scorecard. Transport Canada has expressed some interest in developing consistent measures of congestion and greenhouse gas emissions that could be used for Canada's urban areas. A study on congestion costs is underway to examine a variety of ways that congestion measures could be defined, ranging from total social cost of congestion to facility delay indicators.
Even though a congestion measure is not yet available, TransLink has developed set of project evaluation guidelines in support of a multiple account evaluation( MAE ) process that has been established by the government for major investment analysis. These guidelines serve as the methodological foundation for project evaluation and development of study recommendations. The criteria are divided into four major accounts-direct sector, indirect sector, external, and social accounts. The direct sector relates to the generalized costs, including travel time of the consumers of transportation, and to the capital and operating costs for the producers of transportation. The indirect sector relates to the economic development and land value changes. External accounts reflect crash, air quality,and noise impacts. Social accounts relate to the intergovernmental transfer,neighborhood, and social impacts. The MAE is used to evaluate larger projects and to assess the larger-scale systems effects of network investment. There was some discussion during the scanning study of the need to link system performance measures with the criteria found in the MAE approach. As one TransLink representative noted, consensus is good on what is important within modal categories, but across modes little agreement exists on how multimodal performance should be measured.
Observations
The following are the scan team's key observations from the Vancouver, British Columbia, visit:
| Objectives | Measures |
|---|---|
|
Financial Strength |
Transportation revenue proportion versus other revenue sources Debt ratio Reserve ratio |
|
Financial Performance |
Budget versus actual Transit cost recovered by transit revenues Road expenditures commitment New leveraged capital funds committed |
| Objectives | Measures |
|---|---|
|
Transit System Performance |
Transit service effectiveness: ridership growth Transit service efficiency: peak hours load factor Service reliability: on time performance Service reliability: % of actual service versus scheduled service |
|
Safety and Security |
Number of safety-related incidents per transit passenger trip |
|
Road Network Performance |
Operating condition of major road network |
|
Capital Project Management |
Project performance based on the following: Timeliness Cost Quality Delivery of agreed scope |
|
Environmental Stewardship |
TransLink 's emission-reduction contribution |
| Objectives | Measures |
|---|---|
|
Employee Satisfaction |
Employee ratings of satisfaction and corporate climate Employee ratings of internal communications |
Performance Culture |
Vision, mission, and values implementation Scorecard implementation Completion of individual annual review sessions with staff Assessment of corporate performance against annual plan |
|
Skills and Knowledge |
Percentage of employees with professional development plans Organizational resource capacity to execute current and future strategic objectives |
| << Previous | Contents | Next >> |

