U.S. Department of Transportation
Federal Highway Administration
1200 New Jersey Avenue, SE
Washington, DC 20590
202-366-4000
Road Infrastructure Managed
|
Just over 27 million trips are made in greater London every day, 8.5 million on public transport, 11 million by car or motorcycle, 7 million on foot, and 0.3 million by bicycle. Transport for London (TfL), created in 2000, is the agency responsible for much of the transportation system used by these 27 million trips. Transport for London manages London's buses, subway system, Docklands Light Railway (DLR), and London Trams. It also runs London River Services, Victoria Coach Station, and London's Transport Museum. Only TfL's Street Management Division participated in the presentations during this scanning study, so the team's observations focus on road assets rather than TfL's considerable public transit assets.
The backbone of the Street Management Division's responsibilities is the 580-km (360- mi) road network known as the Transport for London Road Network (TLRN), also designated as the “Red Routes.” The stated aim of TfL is to improve the Red Routes for pedestrians, motor and pedal cyclists, bus passengers, people with disabilities, drivers, and freight movement. Because of their strategic role in London's street network and their concentration of traffic control and safety devices, these routes consist of just over 1 million assets. London's 33 local boroughs manage the remaining roads in London, except for those under the responsibility of England's Highways Agency.
Given the size of the metropolitan area (more than 9 million people), it is not surprising that the stated transportation challenges range from congestion relief (resulting in London's innovative road congestion pricing scheme) to safe pedestrian and bicycling environments. In fact, TfL's business plan and performance monitoring scorecards show that the great majority of the performance indicators relate to the performance of the Underground (subway). In the business plan, Transport for London lists the following as the most immediate priorities:
Transport for London committed a substantial amount of funding to TLRN to reduce the backlog of maintenance needs, which it inherited when TfL was created. This investment has resulted in a decrease in the percentage of roads needing repair from 14.2 to 11.5 percent over a 2-year period.
Transport for London has been committed to asset management for many years. The most important driver for asset management in its early years was a desire to know what assets were TfL's responsibility and the condition of those assets. The national and London governments have also adopted a policy of reducing the road maintenance backlog that had built up over many years, and they consider an asset management program the most effective way to manage such a program. More recently, as was discussed in the England case, the national requirement for whole-of-government accounting procedures, the opportunities for public borrowing of funds for transportation investment, and the national requirement to prepare local transport plans that included a highway asset management plan have led to increased interest in an effective asset management program.
Transport for London's asset management program identifies critical asset needs in the city, determines the most cost-effective strategy for dealing with these needs, and conveys progress to elected officials by relating the results to Best-Value Performance Indicators (BVPIs). In addition, asset management information has been used to value assets and redistribute capital maintenance funds among the different boroughs of London. The following statement from TfL's 5-year business plan in the streets management area shows the important of asset management:[36]
“The funding level for capital road renewal in the Plan means a re-evaluation of priorities. The total 5-Year Investment Program will be focused on striving to meet the government 2010 deadline for clearance of the ‘backlog’. However, the funding levels under this Business Plan means that there is a significant risk to meeting the 2010 target.”
The risk mentioned in this statement is expected to be reduced with the application of asset management principles.
Transport for London focuses its attention on several performance measures, not only for technical analysis, but also for conveying network status to elected officials. The most important of these measures are called Best-Value Performance Indicators (BVPIs), which relate to those network characteristics that are considered most critical and that have the highest value in terms of network effectiveness. London, along with other local authorities, report on the BVPIs mandated by England's Department for Transport. For example, for road network operations, four indicators are considered most important: 1) percentage of working streetlights, 2) dangerous defects made safe or repaired within 24 hours, 3) days of temporary traffic controls, and 4) traffic signals operating effectively. Figure 52 shows condition data on streetlights (ranging from no defects to unsafe). The scan team noted a difference in overall condition between light columns in the first two districts of the city versus the other three. This was explained as primarily the result of data collection by two different contractors, each with a different concept of what was meant by “minor” or “no defects” (a lesson on data consistency when more than one entity is collecting data).
One of the most important government goals for TfL was to reduce the backlog in maintenance needs. This has become an important program performance measure. The following information comes from the annual report for TfL that shows progress toward this goal.
Maintain Strategic Road Network, Change Between 2000 and 2010 |
Measure | Target | Progress |
|---|---|---|---|
Proportion of network in need of maintenance |
Between 7 and 8% |
Substantial improvement |
|
Halt deterioration of local road network |
Halt by 2004 |
Substantial improvement |
For principal roads not controlled by TfL and the Highways Agency, the London boroughs have pooled their resources and chosen one borough, Hammersmith and Fulham Council, to collect data on these roads. The primary measure (BVPI) for these roads is a pavement structural condition index.
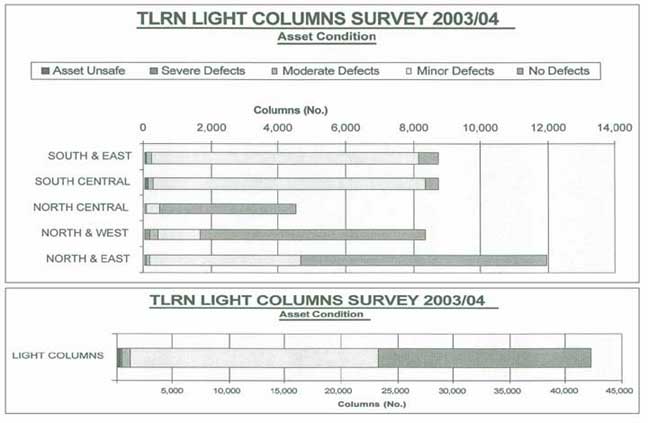
Figure 52.Streetlight inventory and condition assessment in London.
The major asset management system for Transport for London is called the Asset Inventory and Management System (AIMS), part of the geographic information system (GIS) platform used for numerous city planning and management activities. The basic structure for AIMS is consistent with and reflects the functionalities of the United Kingdom Pavement Management System (UKPMS), discussed earlier in the case description of England.
The basic data found in AIMS includes network description (including highway boundaries and road hierarchy and data by lane), 59 different asset types with about 10 to 15 attributes per asset type, condition data, and crash data. The spatial accuracy of the data is 1 meter. In addition, Transport for London employs numerous live video cameras, so the AIMS data includes not only historic data, but also live feeds from cameras on the street network. Figure 53 shows two types of representations available in AIMS. The first one reports the location, geometric characteristics, and condition of a particular asset (in this case, dropped curb). The second shows a real-time feed from a camera that indicates several different assets (bus stop, sign, and information kiosk) and their relationship to what is indicated on plans.
London's approach to pavement condition data collection is based on the Detailed Visual Inspection (DVI) regime of UKPMS. This is carried out in London by walking the network. Forms are coded for visually determined condition (defects and their extent) characteristics. This information is used to report the Best-Value Performance Indicators (BVPI) condition for footways. In the case of roads, this is converted to equivalent Coarse Visual Inspection (CVI) values as required by the Department for Transport, so that BVPI comparisons can be made. Most rural (county) authorities use only CVI condition collection from a slow-moving vehicle.
Transport for London relies on four inspectors and one supervisor to collect data. TfL officials expressed a high level of confidence in the quality of this data because of the ability to maintain direct control of the survey and defect identification. This has been confirmed by the close correlation between prediction from its modeled and actual condition results. TfL also uses the SCANNER or TRACS machine inspection method for road condition data collection, a relatively new methodology for England. TfL plans to work with national and local authorities to develop correlation between the two survey methodologies so that in the future SCANNER information can be used in its pavement model.
Transport for London uses condition index ratings to establish project priorities for both roads and sidewalks. The condition of the asset is rated on a scale of 0 to 100; the bigger the value of the indicator, the worse the condition. Any asset receiving 70 or above is considered in “poor” condition. The “percentage of roads with ratings of 70 or above” is a national BVPI. Transport for London officials have concluded from the experience with this approach that treating pavements with condition index scores of 50 to 70 is the most cost-effective way to prolong pavement life.
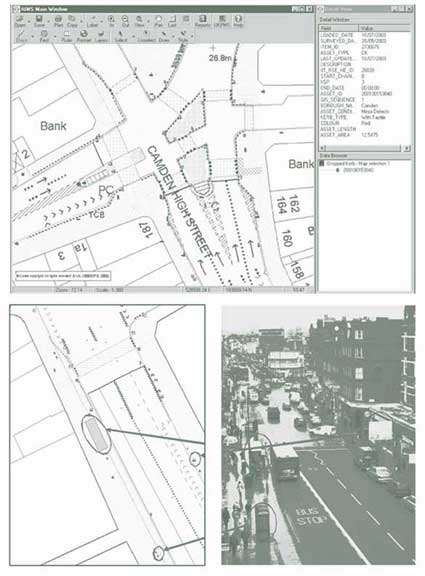
Figure 53.Asset Inventory and Management System in London.
A pavement deterioration model has been developed to examine the future performance of roads and develop a 15-to-20-year investment program. For lighting standards, which appears to be a much bigger asset management issue in England than in the United States, a model is under development to produce similar results. For bridges, a model based on current bridge deterioration data in London is used; a second phase of tying this into benefit-cost analysis is under development.
Transport for London uses the pavement model to test different expenditure scenarios: How much funding is needed to clear the maintenance backlog by 2011? How much funding is necessary to keep road pavement in a steady state of good repair and retain it at this level? What are the optimal funding levels to provide the most cost-effective life cycle investment program? The assumptions that enter into analysis for each condition index range include the appropriate type of treatment for roads and sidewalks, average costs of treated roads/sidewalks, proportion of funds spent, and life cycle of the roads and sidewalks with assumed rates of deterioration.
During the course of the scan team's discussions in England, several other local government experiences with asset management were described as best-practice examples. The following sections provide brief descriptions of these efforts. In addition, the scan team heard from maintenance contractors and an asset management consultant on their experiences and thoughts on local government asset management practice in England. These observations are presented here as well.
Figure 48 shows the percent of local governments with some form of asset management system in place. Many systems are quite simple, while others have been developed by consultants in response to asset management guidance from the national government. An asset management consultant noted that the response of local authorities to this guidance falls into three categories: local authorities that have initiated an effort to develop an asset management plan, local authorities that have formed coalitions with other local governments to develop a generic asset management plan that can be applied in member jurisdictions, and local governments that are not doing anything.
For those making some effort to develop an asset management plan, the steps are straightforward. They include a review of the state of the infrastructure, a gap analysis, assessment of condition data, preparation of an asset management plan, and development of an implementation strategy. According to the consultant, the experience to date with local governments is the following:
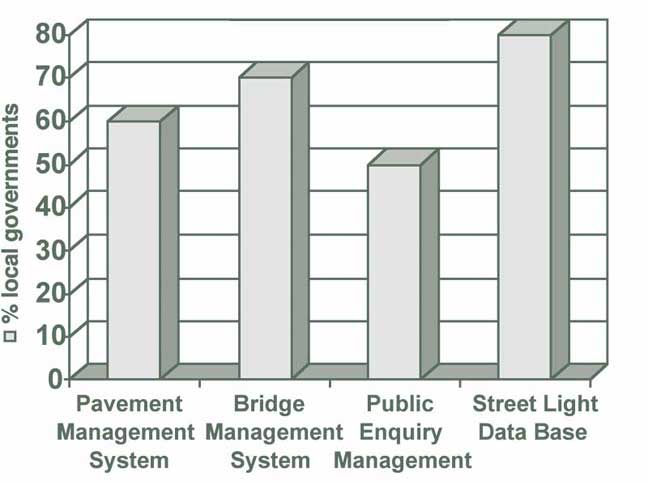
Figure 54.Percentage of local governments using asset management systems in England.
Several issues common to local authority experiences were also identified. The quality of data varies widely; tools and models do not have a good ability to predict future conditions, especially for nonroad assets; the degree of influence over resource allocation has yet to be determined; an internal commitment to changing mindsets and possibly decisionmaking processes is often lacking; funding is insufficient; comprehensive performance measurement and prediction tools are absent; and processes to deal with customer preferences for desired service levels need to be established.
A maintenance contractor presented an interesting overview of the evolving roles of contractors, consultants, and local authority clients over the past several years. In this evolution, the relationships have evolved along the following path:
The consultant's tasks are primarily to do the following:
The contractor's tasks are primarily to do the following:
Two examples illustrate the local government experience with asset management program development.
The Hampshire County Council has developed a Highway Maintenance Management Plan (HMMP) that is integrated into the council's service plan, business plan, and quality procedures. The adopted highway maintenance strategy is intended to do the following:
The plan defines the working procedures and codes of practice to be adopted by all those involved in highway maintenance.
As an illustration, the key objectives and strategies for bridges were defined as follows:
Strategies to be used to accomplish the bridge objectives included the following:
Gloucestershire was one of the first local authorities to begin the process of implementing an asset management strategy in light of governmental directives to tie transportation plans and asset management together. It has adopted the Framework for Asset Management developed by the County Surveyor's Society (see Chapter 5) for application in the United Kingdom. The County Council has established an asset working group, which has produced several point-of-departure products, including a statement of objectives, a list of desired outcomes, definition of asset resources, and the identification of risks associated with asset condition.
--Roadway |
--Urban sidewalks and paths |
--Street lighting |
A gap analysis identified the infrastructure difference between current and desired levels of service, and the cost of closing this gap. In addition, this analysis examined the benefits to the citizens of Gloucestershire. An implementation plan is being prepared that identifies priorities and needed resources.
In many ways, the London and other local government examples show asset management practice in its infancy. Many local governments are just now beginning to develop an asset management plan in response to national legislation. Much of the data collected are visual condition data, although in some cases these data are augmented by instrumented vehicle inspections. Nonetheless, it is impressive that a large number of local authorities have some form of asset management system that produces information for decisionmaking. Some interesting characteristics of this experience include the following.
London and other local government asset management activities are guided by the national Best-Value Performance Indicators that relate not only to transportation, but also to other service areas. The use of such national indicators provides consistency in data reporting and comparison, as well as economies of scale in terms of data-collection technologies and programs. This consistency (along with a common asset management framework) has allowed several local authorities to form working groups that are developing a generic asset management program for use in member jurisdictions.
Transport for London conducts scenario analyses to understand better the consequences of varying budgets on the performance and condition of the road network. Similar capabilities are being developed for streetlights and bridges.
London's geographic information system (GIS) platform has provided Transport for London with an impressive ability to display and work with the asset database. Not only can engineers and planners look at as-built plans, but in many cases, video links provide the ability to see the asset in real time. In addition, the GIS platform is used to convey information to public officials on both the current status of infrastructure and on the progress being made.
The use of contractors and consultants to provide asset management services appears to be widespread among local governments. This capability provides a level of consistency in asset management applications. The advocacy of these contractors and consultants for asset management is an important catalyst for pushing advances in asset management practice. One challenge of using different contractors for different asset management tasks was seen in the London case, where the condition of streetlights from one district to another was dramatically different presumably because two data-collection contractors had different interpretations of what was meant by good or poor condition.
[36] Transport for London, Business Plan, 2005/06-2009/10, Office of the Mayor of London, undated, see: http://www.tfl.gov.uk/tfl/downloads/pdf/business-plan/2005/business-plan-05.pdf.

