U.S. Department of Transportation
Federal Highway Administration
1200 New Jersey Avenue, SE
Washington, DC 20590
202-366-4000
Transportation Infrastructure Managed
|
The city of Edmonton, Alberta's capital, has just over 700,000 people in a metropolitan area of about 1 million. Strategically located to serve the natural resources industry, Edmonton is expected to capture a large share of future investment in the province. For example, Can$13 billion (US$10.4 billion) of the Can$100 billion (US$80 billion) in construction announced or underway in the province is occurring in Edmonton. Growth in population and employment is expected to place tremendous pressure on the 12 asset areas for which the city is responsible.
Edmonton defines the replacement value of its assets as the cost of infrastructure if it were replaced in today's dollars (estimated at Can$19.2 billion (US$15.4 billion)). The second-largest component of this estimate is transportation and streets, with a nearly Can$7.5 billion (US$6 billion) replacement value.
Roads constitute 38 percent of the city's total unfunded needs. About 60 percent of the road investment (Can$311 million (US$235 million)) and 54 percent of the transit investment (Can$123 million (US$93 million)) are targeted at maintenance and rehabilitation needs. Major funding sources for transportation include debt, tax levies, a provincial fuel tax (5 cents/liter—one of the few in Canada), and developer fees.
According to officials, the critical issues facing the city's transportation system include a significant backlog of necessary work and inadequate funding. The overall physical condition of transportation infrastructure is considered fair, but problems exist in collector and residential roads (in mature neighborhoods), alleys (in mature neighborhoods), street lighting, traffic signals, traffic signs, the light rail transit (LRT) fleet, bus terminals, transit fare-collection equipment, and transit bus and LRT communications equipment.
Of interest to this scan, Edmonton's experience in asset planning and management led to the development of Canada's National Guide to Sustainable Infrastructure (InfraGuide) Best Practice on “Managing Infrastructure Assets.”[34]
In addition, Edmonton has played a lead role in the development of InfraGuide's new Managing Infrastructure Assets Knowledge Product, released in June 2005.
Edmonton's adopted Infrastructure Strategy (1998) was based on a goal of ensuring that Edmonton's infrastructure is “in a good state of repair, and rehabilitation and development programs are adequately funded on an ongoing basis, and are as efficient and effective as possible.”[35] This strategy was founded on concerns over many years of deferred maintenance caused primarily by an economic downturn and corresponding funding shortfalls.
Edmonton officials noted the following major drivers for asset management:
City officials described these drivers in general terms as leading to Edmonton becoming a “knowledgeable owner.”
No legislative mandates for asset management have come from the federal or provincial level, but city officials stated that funding programs from these sources increasingly require evidence of asset stewardship before funding will be awarded. They think this will become more prevalent in the future, so an asset management program could become strongly tied to the city's ability to obtain funding support.
After adopting the Infrastructure Strategy, the City Council created an Office of Infrastructure in March 2000 (see figure 48). Three departments, Asset Management and Public Works, Transportation and Streets, and Community Services, form the majority of the city's asset base and contribute an apportioned share of the office's consulting budget. The office's mandate is to report the state of the city's infrastructure, and implement strategies and tactics to address the gap between capital needs and available funding. The office updates the city's infrastructure inventory and investment needs annually and submits a formal update of the Infrastructure Strategy to the City Council every 2 years.
The office is also responsible for monitoring strategy recommendations and conducting corporate life cycle costing and a risk assessment to identify the risk associated with deteriorating infrastructure. The role of the office is as a strategic coordinator; implementing recommendations falls primarily to city departments. In this way, the office and city departments operate as a cross-functional corporate team. The Office of Infrastructure has four employees.
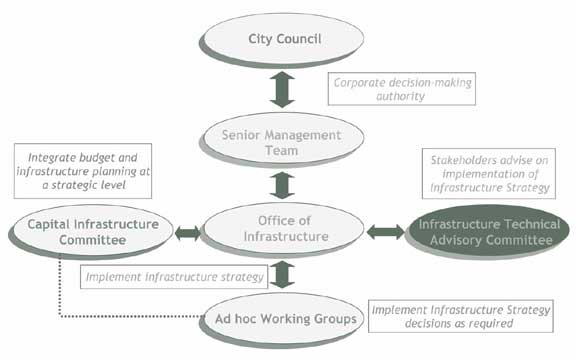
Figure 48.Asset management organization in Edmonton.
The city of Edmonton's director of infrastructure planning oversees the Office of Infrastructure (OIT). Responsible for managing OIT, the position's primary mandate is to monitor, implement, and update strategies to address the growing disparity between the city's infrastructure capital needs and available funding. An Infrastructure Working Team (IWT), representing city departments with an asset management role, assists OIT in collecting data and preparing information. A Capital Infrastructure Committee (CIC), composed of nine managers from key civic departments, provides general guidance in implementing the Infrastructure Strategy.
An Infrastructure Technical Advisory Committee (ITAC) has also been created to provide an opportunity to consult with 20 external professional and technical organizations. The ITAC mandate is to 1) provide advice to the city as it improves and validates strategies, processes, and planning tools, 2) provide a broad scope review of infrastructure issues, and 3) foster two-way communications between the city and key stakeholders. According to Edmonton officials, ITAC members benefit from their participation by the following:
The Office of Infrastructure reports to the Senior Management Team monthly, providing updates of work undertaken and reporting on any new information that has come to the attention of office staff. The office is required to report to the City Council every 2 years on the state and condition of the city's infrastructure. This report includes the inventory and investment needs of the city, as well as investment options and revenue opportunities.
According to officials, the most important role of the Office of Infrastructure has been its validation of the infrastructure gap, and its identification of the rehabilitation and growth requirements of the city's infrastructure. In identifying these needs, the office has also created tools to help determine the critical areas that require immediate attention. For example, a risk assessment of the city's assets determined an increased risk with the city's service connections (pipes that provide sanitary and/or storm sewer connections to the sewer mains). As a result, this was taken into consideration in the budgeting process, removed from the operating budget, and repositioned in the capital program.
The agency with direct responsibility for road asset management is the Transportation and Streets Department. The department designs, builds, operates, and maintains Edmonton's roads, and is organized around strategic planning, street engineering (including design, construction, maintenance, and services), traffic operations, and transit. Maintenance is primarily “clean it and fix it,” while rehabilitation is considered a capital project. The department maintains a core expertise for asset management and contracts out rehabilitation/reconstruction work, but does maintenance work primarily in-house.
Part of the organization for asset management is the linkage among asset managers, elected officials, and the general public. City officials have produced a very impressive document called Thinking Outside the Gap, Infrastructure Strategy Report 2004, a biennial infrastructure strategy update report to the City Council. This report identifies strategies for dealing with the infrastructure challenge facing the city. This update included strategies on maximizing use of existing infrastructure, continuing to develop a comprehensive asset management system (including risk assessment and life cycle costing), achieving sustainable levels of service, and promoting shared services among communities.
Each year since 1998, the city of Edmonton has developed a 10-year long-range financial plan (LRFP) to meet forecasted needs. The LRFP presents funded and unfunded categories, with the unfunded portion constituting the infrastructure gap. A Transportation Master Plan (TMP) broadly outlines allocation targets for road-versus- transit projects and growth-versus-rehabilitation projects. This plan also outlines a series of 10-year priorities.
At the city level, a business case must be prepared for each project and is taken under advisement by the CIC, which ranks projects from highest to lowest priority. Several key factors are considered in this prioritization, including deterioration of infrastructure, service needs, and regulatory requirements; the impact of investment on safety, quality of service, quality of life, and economic growth; infrastructure condition; expected infrastructure performance; return on investment; and demonstrated benefits.
One of the major constraints on the city's transportation funding is the eligibility of the fuel tax rebate revenues from the Province. The fuel tax rebate can only be used for the arterial roadway system (both rehabilitation and growth-related projects) and for major transit system investments (both rehabilitation and growth-related projects). The Province also requires that the physical condition of the arterial roadway infrastructure be maintained, which has resulted in maintenance set-asides for this purpose. Thus, city officials believe that programmatic requirements of funding sources drive rehabilitation priorities.
For pavement maintenance decisions, the city's pavement management system is used as a first-cut identification of the most critical needs that enter into the city's 5-year program. Different levels of service are determined corresponding to different budget assumptions.
“Pay me now, or pay me later . . . and it will cost much more later!”
—Edmonton city official in response to a question on what the asset management message should be to elected officials
After the infrastructure gap was verified, the City Council amended its debt policy to permit borrowing of Can$50 million (US$40 million) per year over 5 years to pay for large, high-priority capital projects. The borrowed funds are paid for by a 1 per cent increase in property tax and are allocated to projects that would otherwise be unfunded, including interchanges, road rehabilitation, and road improvements. According to city policy, debt-financed projects must be in the range of Can$10 million (US$8 million), have an asset life of at least 15 years, and must fit into approved capital plans. Having committed $100 million in debt financing for key infrastructure projects in 2003 and 2004, Edmonton has already made significant strides in dealing with key infrastructure issues.
Edmonton uses system performance measures of condition, functionality, and demand capacity for all asset categories. These are the primary measures it uses to determine if its infrastructure is performing at desired levels. The degree to which infrastructure spending is meeting (or not meeting) the infrastructure gap is also considered an important measure.
An infrastructure report card is prepared annually that reports on various asset characteristics. Departments provide data on the following infrastructure characteristics: replacement value, quantity and unit of measure, average age, expected asset life, physical condition rating, demand/capacity rating, functionality rating, capital budget for rehabilitation, growth, other projects (past 3 years), other projects (current year), operating budget for operations and maintenance (current year), sources of financing, funded and unfunded 10-year needs for rehabilitation, growth, and other projects (taken from the 10-year Long-Range Financial Plan).
Besides the usual condition and ride quality measures found in almost every asset management program, Edmonton uses a pavement quality index (PQI), which is a composite of a visual condition index, road condition index, and structural adequacy index. PQI is based on a mathematical relationship developed by relating experts' visual ratings to instrumented values for the same sections. A separate PQI formula exists for different combinations of indices.
Officials are also conducting a pilot project to determine public desires on service levels. This effort reflects a basic philosophy that performance measures should relate to public willingness to pay, as well as to the implications of failing to achieve desired service levels.
The physical assets monitored in various asset management systems include the following:
Edmonton began using the Municipal Pavement Management Application (MPMA) in 1986. MPMA defines a network pavement rehabilitation strategy, optimizes the selection of individual road sections, and recommends a 5-year capital investment program. City officials view MPMA as having several beneficial characteristics, including decision trees that are easy to customize, output that is based on cost effectiveness, deterioration models that allow local parameters to be input, good network analysis capabilities, and good communications/graphics modules.
The Transportation and Streets Department collects the following types of data: For pavements, surface distress is defined by a visual condition index (VCI, collected manually using the APWA Paver method), roughness is defined by a riding comfort index (RCI, collected with a profilometer), and structural capacity is defined by a structural adequacy index (SAI). Rutting is collected by a vehicle-mounted rut bar integrated into the data-collection process for surface distress. For sidewalks, surface distress (the only condition data collected) is collected electronically. For bridges, all individual structures are rated manually.
The Transportation and Streets Department collects arterial, collector road, and sidewalk data biennially. Local streets are surveyed every 4 years, but structural capacity data is collected when needed. Twelve temporary staff, three permanent staff, and one supervisor collect data for pavements and sidewalks. Data-collection costs are about Can$500,000 (US$400,000) per year.
Edmonton is responsible for 12 infrastructure areas ranging from roads to affordable housing. To provide a fair comparison across all infrastructure categories, the Office of Infrastructure has devised a ranking system that rates the physical condition, demand/capacity, and functionality of individual infrastructure elements. Plan Edmonton, the city's municipal development plan, identifies the following areas as being most important for city investment: safety and public health, growth, environment, preservation of infrastructure, and service to people.
City departments worked together closely to develop a consistent ranking methodology, which established a common vision for a corporate-wide strategic asset management approach. The Transportation and Streets Department traditionally kept good data on its needs, but many other infrastructure areas did not have the same level of information and had to conduct data-gathering activities to reach parity with the road asset database. This effort has facilitated the comparison of disparate infrastructure types, and has set the stage for the corporate risk assessment and life cycle costing processes.
The Transportation and Streets Department uses its own measures, primarily the pavement quality index (PQI), to determine its recommended priorities. The department also uses deterioration curves to determine the change in PQI based on assumed budgets. For example, the 2004 Transportation and Streets Infrastructure Report presented the following PQI performance with an assumed continuation of current funding:
| Roadway Type | Current PQI (2003) | Year 2008 PQI |
|---|---|---|
Primary highway |
7.0 |
6.9 |
Arterials |
5.7 |
5.3 |
Collectors |
5.1 |
4.5 |
Locals |
5.2 |
4.7 |
Alleys |
3.3 |
2.8 |
Other assets, such as streetlights, transit equipment, traffic signs, and parking meters, are rated as being in good, fair, or poor condition.
Figure 49 shows how the rating scheme works for Edmonton's roads. This approach borrows from the report card format used by the American Society of Civil Engineers (ASCE) when rating U.S. infrastructure. By using such an approach to analysis, Edmonton officials are able to determine the level of unfunded infrastructure needs in the city (14 percent in poor condition and Can$4.1 billion (US$3.1 billion) investment needed from 2005 to 2014). The condition rating varies by road classification; 5 percent of major arterial roads and 50 percent of alleys are in poor condition. This information, along with the amount of infrastructure considered in poor or very poor condition and the percentage of the replacement value allocated each year for asset preservation, is used to determine whether the level of infrastructure investment is adequate. National experts have recommended that annual investment in the city's assets be 2 to 4 percent of the replacement value. The city spends Can$178 million (US$134.4 million) each year on infrastructure rehabilitation, compared to a recommended 2 percent of replacement value of Can$383 million (US$289 million).
The Municipal Pavement Management Application is used to analyze different performance and budgetary scenarios. For example, Edmonton officials can look at cost minimization and maximum performance scenarios or combinations of the two. Figure 50 shows how MPMA can be used to examine the distribution of pavement condition (the x-axis) given different budget allocations.
Edmonton was one of the few sites using a formal risk assessment process to evaluate the impact of failure for a given element of infrastructure. The first step in the risk analysis process was to segment infrastructure assets into logical groupings based on common characteristics. For each segment (e.g., one road kilometer), data were collected describing the inventory, state, and condition, and the 10-year rehabilitation financial estimates for that asset. The condition of an asset was categorized using Edmonton's standardized rating system. Conditions were assessed by reviewing the assets within a given department through a combination of workshops and independent analysis. Failure was assumed to occur in two ways, either suddenly and unexpectedly, or gradually and expectedly. The approach uses 155 different deterioration curves and probabilities to determine expected failure.
Figure 51 is an example of the type of analysis that can result from this effort. In this figure, the severity of an asset failure is compared to its replacement value. Those assets found in the upper tier and farthest to the right are considered greater priorities.
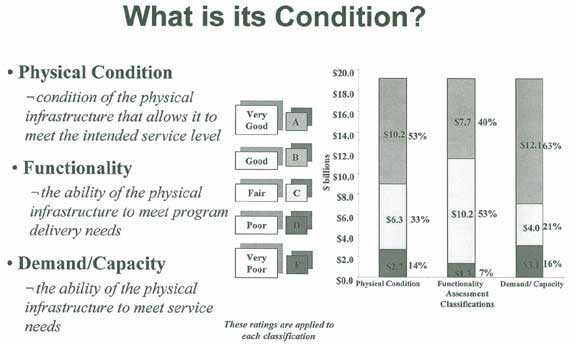
Figure 49.Rating Edmonton's roads by condition, functionality, and demand.
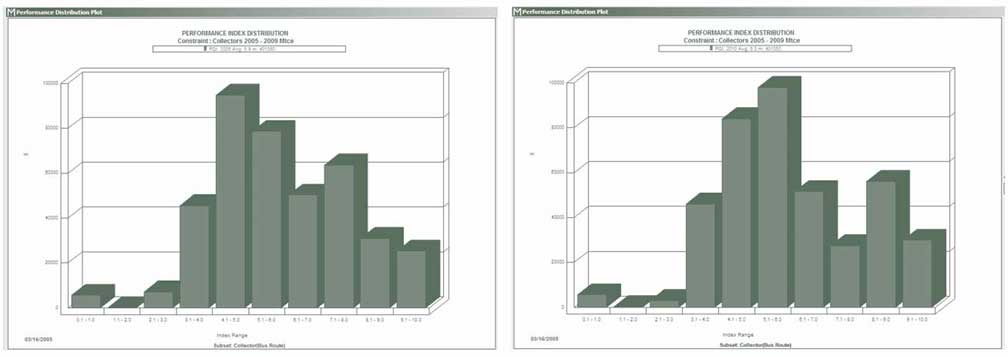
Figure 50.Scenario analysis in Edmonton showing different condition time streams.
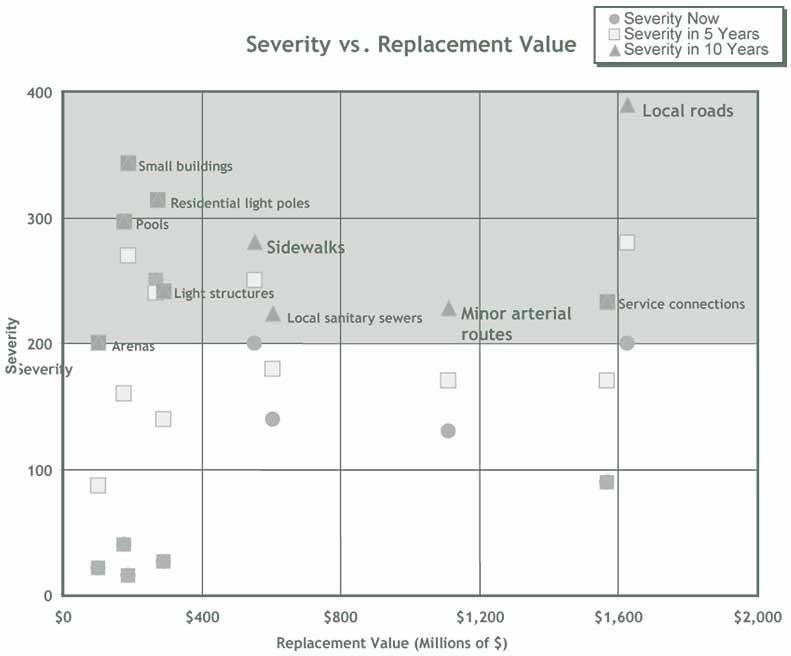
Figure 51.Example of risk assessment in Edmonton.
The Office of Infrastructure has been promoting the use of corporate-wide life cycle costing in infrastructure management, although the Mobile Equipment Services (Fleet) Department is the only one that has fully implemented such a system. Eventually, life cycle costing is expected to be applied at the strategic, network, and project levels. A life cycle costing approach was used in assessing the status of Edmonton's sidewalks (a Can$500 million (US$400 million) asset). In addition, Edmonton officials have used life cycle costing to examine the possibility of increasing service lives of assets through initial design concepts. A recent decision to use a granular base for new and reconstructed roads was based on the finding that it would increase overall useful life, compared to the use of full-depth asphalt and cement-treated bases.
The city's finance group is also looking at an integrated capital and operating budget to get a better sense of life cycle cost estimates. The Office of Infrastructure is examining criteria that could be used in such an integrated budget concept to provide an improved balance among renewal, upgrades, and capacity expansion.
In establishing an Infrastructure Strategy and undertaking an investment needs analysis, Edmonton's Office of Infrastructure has achieved a high level of credibility in the asset management process. The approach of assessing different assets and portraying the assessments in tabular and graphical form has allowed elected officials and the public to understand both the importance of the city's assets and the need to support them financially. Through its asset management efforts, Edmonton has demonstrated to others in government that municipalities require additional funding to keep infrastructure in reasonable condition.
Edmonton was one of the few cases the scan team observed in which tradeoff analyses among different asset categories were conducted. Edmonton does not use models or formulas to conduct a rigorous tradeoff assessment. However, by using common criteria—condition, functionality, and demand/capacity—officials are able to get some sense of the benefit to the city of funding different asset types. The use of an infrastructure scorecard, similar to that used by ASCE, is a good way to illustrate to the general public the status of the city's infrastructure. In the pavements area, the use of the PQI measure and scenario analysis also allows officials to gauge the tradeoffs in system performance associated with different budget strategies.
One innovative characteristic of Edmonton's approach to asset management was the creation of an infrastructure technical advisory group. Not only is this advisory group critical for educating key constituencies on the importance of infrastructure, but it also provides a sounding board for finance and policy proposals that can lead to greater public and political attention to the asset challenge facing the city. This advisory group is part of a much larger communications strategy that has surrounded the city's asset management program. Public dialogue around asset needs, and the adoption of a “made-in-Edmonton” solution, is widely understood and endorsed by the citizens.
Finally, Edmonton is way ahead of other similar municipalities in considering risk part of its prioritization process. The combination of the risk of failure and the level of severity associated with such a failure allows city officials to give greater attention to assets critical to the economy and quality of life in Edmonton. The scan team did not see anything like the approach Edmonton takes in any other sites it studied.
[34] See www.infraguide.ca.
[35] City of Edmonton, Thinking Outside the Gap, Opportunities to Address Edmonton's Infrastructure Needs, Infrastructure Strategy Report 2004, Edmonton, Alberta, see: http://www.edmonton.ca/InfraPlan/Infra/City%20Docs/Infrastructure%202004%20v3.pdf.

