U.S. Department of Transportation
Federal Highway Administration
1200 New Jersey Avenue, SE
Washington, DC 20590
202-366-4000
VicRoads—www.vicroads.vic.gov.au
Transportation Infrastructure ManagedBy VicRoads
By local governments
|
Victoria, about the size of Michigan, encompasses about 3 percent of Australia's area. However, with 5 million people (3.6 million in Melbourne), it is the most densely populated state in Australia. Victoria also has 4.1 million registered vehicles, representing about 33 percent of the Australian vehicle fleet, and handles 25 percent of the country's road freight on its 155,000 km (96,315 mi) of roads.
VicRoads is the responsible authority for the road and traffic management of 22,000 km (13,671 mi) of the state's most important arterials, handling about 70 percent of the vehicle-kilometers travelled. The total value of the assets associated with this network is estimated at A$11 billion (US$8.3 billion). With annual program budgets of about A$861 million (US$650 million), maintenance budgets of A$530 million (US$400 million), and revenues just over A$2.5 billion (US$1.9 billion), VicRoads is one of the most capital-intensive and infrastructure-oriented agencies in Victorian government. The majority of funds for road improvements come from state government.
According to VicRoads officials, the major issues facing Victoria's road network are 1) increasing travel demand, 2) growing congestion in metropolitan road networks, 3) aging infrastructure, 4) rising environmental and community expectations, and 5) the challenge of optimizing system performance when individual travelers seek only to maximize their own utility. Asset management-related community expectations include ride quality and safe and efficient travel through work zones. VicRoads officials are particularly concerned about a national trend to allow larger trucks to use the highway network. Victorian pavements are much thinner than those in the United States, so with increasing truck mass limits, they are expected to deteriorate even faster.
VicRoads officials identified several factors that led to increasing interest in asset management. First, there was a perception in the late 1990s and early 2000s that agency decisions historically had not adopted a system-wide perspective that led to the most cost-effective solutions. A comprehensive and system-wide perspective was desired, especially for to asset stewardship.
Second, VicRoads faced shrinking budgets in real terms, so it had to focus on the best use of its funds for accomplishing its mission. An asset management program based on life cycle costs was considered a major tool to support such decisions.
Third, the public, elected officials, and VicRoads officials became increasingly concerned about the risks associated with road performance (e.g., safety, skid resistance, etc.). Because of these concerns, a risk management approach was developed that evolved from the application of simple investment rules for reducing risk to comprehensive data collection and deterioration modeling to predict future risks. It was clear to VicRoads officials that some agency activities (e.g., grass cutting) did not carry as much risk as others (e.g., slope stabilization), which led to some budget reallocation (e.g., cutbacks in mowing budgets).
Fourth, the Victorian government, in particular the Department of Treasury, has established principles and guidelines for asset management at the state and local levels. In a Treasury document entitled Sustaining Our Assets, the service delivery model for the state emphasizes four main features:[31]
The fifth, and most recent, driver for interest in asset management was the passage of the Road Management Act in 2004, which dramatically changed the legal liability of public agencies for road design and operations.[32] Previously, government officials had immunity under the concept of nonfeasance. The Road Management Act changed this to require due diligence in designing, operating, and maintaining a road network, and having in place a process for reducing reasonable risks. A need existed to provide some legal surety on the level of maintenance deemed reasonable. This led VicRoads to rely more heavily on an asset management program to indicate the systematic process it was following for dealing with road risk.
The act requires a Register of Public Roads to indicate agency responsibility for roads in Victoria. The register must reference where responsibility for a road changes (e.g., transfers, delegation, Ministerial Directions, etc.). One result of this act is that VicRoads and 78 local councils must have a Road Management Plan consisting of a statement of responsibility, a road infrastructure management system, and/or a statement of road maintenance standards. About 80 percent of the local councils have opted for a road infrastructure information system. The following language in the act indicates the basic components of a local asset management policy:
Figure 31.An integrated perspective of asset management in Victoria.
“As a minimum, councils need to have an asset management policy and strategy to provide direction and guidance for asset management planning. Asset management tactics translate the broad strategic goals to specific goals and objectives, generally through the development of asset management plans, which provide more detail and long-term projections. Operations comprise detailed action plans and information with a one to three year outlook to provide for the delivery of the defined level of service.”
VicRoads' own Road Management Plan includes sections on overall policies and practices for processes relating to road infrastructure maintenance, and the responsibility of VicRoads road managers for road maintenance.[33]
The scan team noted the issue of nonfeasance and legal liability for road condition and operation in other Australian states as well. However, many other states are waiting to see what happens in Victoria with legal challenges and the role of asset management in demonstrating due diligence.
At the state government level, an Infrastructure Planning Council and an Infrastructure Delivery Cabinet Committee have been established to guide the government's infrastructure policies. In addition, the government has fostered public-private partnership arrangements through its Partnerships Victoria initiative (see section on toll road examples).
VicRoads defines asset management as “a systematic process of maintaining, upgrading, and operating physical assets cost-effectively; which combines engineering principles with sound business practices and economic theory; that provides tools to facilitate a more organized, logical approach to decisionmaking; and that offers a framework for handling both short- and long-range planning.” As several VicRoads officials stated, however, an asset management approach to business is also very much an organizational culture issue.
“It is fine to have asset management principles, but if you do not have an asset management mindset incorporated into your agency procedures and into service contracts, and data to determine what you are actually doing, you are kidding yourselves.”
— VicRoads official
The road system management group, one of VicRoads' four core businesses, is responsible for asset management (the other core businesses are road safety, traffic and transport integration, and registration/licensing). About 35 equivalent full-time staff members are part of VicRoads' asset management program statewide. A position of manager for asset management has been created in VicRoads with the following responsibilities:
In the early 1990s, VicRoads adopted a client/provider model as the major means of program delivery. This meant asset management strategies (e.g., maintenance) could be delivered either by private contractors or by VicRoads labor with service agreements (whichever won the job). Where contracts have been used, VicRoads has experimented with two types, contracting for a specific function (e.g., resurfacing) in a specific geographic area, or contracting for a function statewide. These contracts are performance based, which VicRoads officials stated makes an agency-wide asset management program even more critical.
VicRoads' commitment to asset management has resulted in its funding of several research projects (about A$1 million (US$76,000) a year) on such topics as 1) getting better value from agency activities, 2) improving useful life from pavement treatments, 3) understanding network condition, 4) understanding the performance of treatments, and 5) improving the understanding of risks.
To a large extent, asset management's role in VicRoads' decisionmaking is closely linked to the Department of Treasury's concept of “optimal asset management.” This concept states that this level of asset management is achieved by the following:
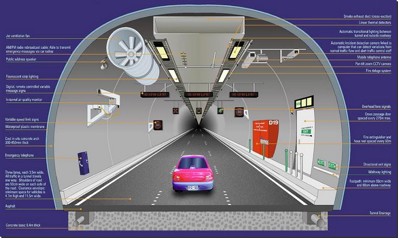
Figure 32.Many Australian cities are building major new highways by tunnelling under the city, making tunnels an important component of agency and private concessionaire asset management programs.
Since 2004, VicRoads has used a Road Infrastructure Management System (RIMS) that sets out the policies and procedures to achieve road maintenance standards. RIMS consists of five phases: developing standards and guidelines, developing a maintenance program, implementing a maintenance program, auditing, and reviewing. Figure 33 shows the flow of decisionmaking in RIMS.
RIMS targets deficiencies in roads and bridges through roughness, cracking, and seal width measures, and maintains the network in a fit-for-purpose condition. This is done by identifying effective and appropriate levels of low-cost treatments to avoid the need for more expensive treatments, and by applying rehabilitation treatments on roads road users assess as rough. Road maintenance standards are used to 1) identify defects with potentially hazardous consequences, 2) define the desired frequency of inspection, and 3) establish desired response times.
Examples of programs that have resulted from this process include the following:
Stitch in Time (A$164 million (US$124 million))—A strategy to deliver safe, user- acceptable, and economically efficient pavement conditions at the least cost to the community. It is based on target pavement conditions determined from user perceptions (pavement roughness for the general community, and rutting and cracking for road managers) and economic efficiency. The overall target was to resurface 10 percent of the network each year, a dramatic change from the 4 percent average before the program. The current program reaches 8 percent of the network. The program components of Stitch in Time include the following:
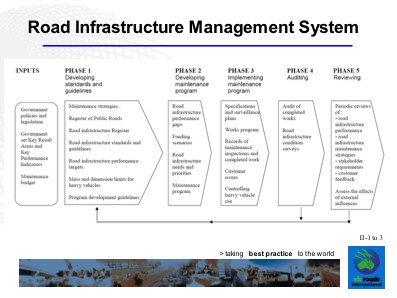
Figure 33.Road Infrastructure Management System at VicRoads.
Victoria's arterial bridges (A$25 million (US$18.9 million))—A strategy to rehabilitate bridges.
Roadside management (A$35 million (US$26.4 million))—A strategy to improve safety and condition of the roadsides.
VicRoads also uses highway management studies to identify and prioritize improvements on key arterial routes in Victoria. These studies look at the context of the route, its function and use, existing conditions, performance on standards, and critical transport issues, and make recommendations on appropriate strategies.
“The hardest thing in asset management is saying, 'Great job on the 80 percent perfect solution!'”
— VicRoads official in response to a question on how road maintenance and rehabilitation investment compares to new construction
Asset management is also integrated into agency activities that link desired performance outcomes to the asset management framework. Figure 34, for example, shows VicRoads' Roadside Management Strategy, which involves several stages:
Figure 35 shows a similar concept for arterial bridge management in Victoria.
VicRoads conducts standardized analyses to monitor network performance. For pavements, these include determining the following:
Figure 36 shows the information produced in VicRoads and its relationship to corporate reports. Along with other Australian states, VicRoads has adopted a network condition indicator that is reported nationally to allow comparisons among the states—the Smooth Travel Exposure (STE). STE is defined as the proportion of travel undertaken each year on urban or rural roads with surface roughness at less-than-desired minimum levels of roughness (4.2 IRI). Target values are 93 percent of rural roads and 91 percent of urban roads meeting this threshold, and 99 percent of arterial roads accessible to legal vehicles.
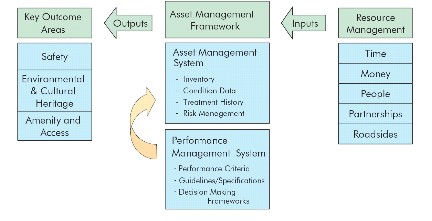
Figure 34.Roadside management framework at VicRoads.
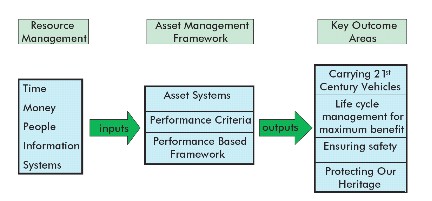
Figure 35.Arterial bridge management and asset management at VicRoads.
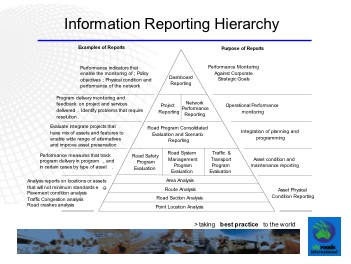
Figure 36.Information reporting hierarchy at VicRoads.
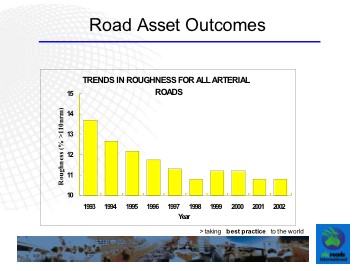
Figure 37.Performance indicator reporting at VicRoads.
The Victorian government has also adopted performance indicators for a variety of issues such as public transit patronage, road congestion, and freight modal share to the ports. Figure 37 is an example of VicRoads' performance indicator monitoring.
VicRoads' strategy for managing the performance of bridges on the arterial system is also based on performance criteria. This strategy is divided into several themes, some defined with asset-related measures. They include the following:
Performance Criteria
Performance Criteria
Performance Criteria
For road maintenance, specific standards are established that act as triggers for maintenance efforts. For pavement rehabilitation, for example, it is expected that between 0.5 to 1.5 percent of the network will receive rehabilitation treatments each year. Roughness minimum requirement triggers for maintenance activity on different road types include the following:
The results of several years of performance monitoring of pavement roughness indicates that VicRoads has been successful in improving this measure.
VicRoads uses asset data for a variety of purposes. At their most basic level, data are used to monitor road conditions and to report on performance indicators. The results of these efforts are used to develop policies aimed at correcting deficiencies and establish maintenance programs and targeted rehabilitation efforts. Data are also used to justify maintenance investment to elected officials and benchmark VicRoads' efforts with other Australian states.
VicRoads uses four primary asset systems to support its asset management program. A Road Asset System (RAS) provides basic information on pavement condition and performance, and retains a history of previous improvements. A Road Crash Information System (RCIS) includes data on crash records and road safety history. A traffic database compiles traffic volumes and characteristics. A financial system (PARMS) keeps track of costs and budgetary items. The systems are linked by a State Road Referencing System (SRRS) so that data can be combined and referenced at identical locations.
Data on electrical systems are maintained in a central database that includes traffic signal inventory, phasing plans, traffic controllers, closed-circuit TV, incident detection devices, and street lighting. Maintenance records are also maintained in this database.
VicRoads is an international leader in the application of ITS technologies and has numerous ITS assets to keep in operating condition. The ITS inventory includes details on the asset (location, warranties, contractor, etc.), record of faults, corrective actions, special operating conditions, performance levels, and maintenance strategies.
“Those consuming infrastructure today are responsible for its replacement.”
— VicRoads official
Maintenance records are kept in a various forms, ranging from hard copy to databases. Selected maintenance treatments are also recorded in VicRoads' financial system and uploaded into RAS. VicRoads is reviewing these maintenance systems and procedures, and expects to restructure and centralize them.
Facilities and feature data (guardrails, sign type and location, and roadside facilities such as rest stops) are kept in a variety of database modes, including hardcopy records and spreadsheet databases.
Customer information consists of simply recording road asset defects identified by the public in a spreadsheet. VicRoads has developed a functional specification that will be used to create a more integrated customer information system that will at a minimum interface with a proposed maintenance system.
Figure 38 shows the direction that VicRoads is heading on an integrated asset management information system.
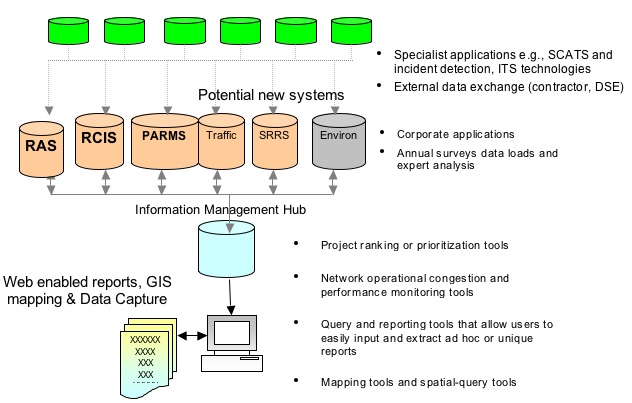
Figure 38.Targeted road information management system at VicRoads.
Data are collected on a variety of network and travel characteristics, using a range of data-collection tools. The primary data-collection activities relate to pavements, bridges and other structures, electrical systems, facilities and features, road use and performance, and customer information.
For pavements, video condition surveys are conducted primarily of roughness, cracking, and rutting characteristics for every 100 meters on the outer lane only. These data are collected annually by private contractors on 50 percent of the network. A Surface Inspection Rating (SIR) procedure is used to collect pavement surface data on homogeneous road sections (seven seal and five asphalt parameters considered). About 33 percent of this network data are collected annually by private contractors. Deflection data for pavement design and skid resistance testing are conducted using a SCRIM vehicle (see New Zealand case for SCRIM description). The SCRIM vehicle is used in particular to test skid resistance at major intersections, where the safety risk is highest.
For bridges, the Road Asset System has a module that contains inventory and condition data for bridges, culverts, noise walls, and major gantries. The majority of bridges on the VicRoads network are subject to a four-level inspection and associated risk-based ranking system. Inspections consist of Level 1—routine (6 monthly), Level 2—condition assessment (2 to 5 a year), Level 3—structural safety assessment (when needed), and Level 4—load capacity assessment (on request).
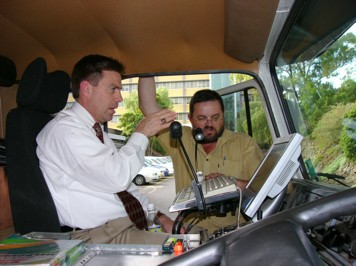
Figure 39.Scan team member Lacy Love (left) discusses use of the SCRIM machine to collect pavement data with a machine operator.
VicRoads has established information technology system and data management principles to manage data as a resource. The intent of these principles is to develop a corporate-wide understanding of road asset information, improve information accessibility, reduce data management costs, and align data requirements with business goals and objectives. Guidelines have been developed for data maintenance to ensure integration and reduce duplication and redundancy.
Some of the principles guiding data management involve assuring data quality. VicRoads has established a rigorous set of guidelines and processes for assuring high-quality, reliable data. Historical records, cross verification with data collected or captured as part of other programs, comparison of treatment data with condition survey data, comparison of condition survey data with surface inspection data, rigorous specification requirements, and audits of data-collection processes are used to develop a high-quality database. For Level 2 bridge inspections, for example, 5 percent of inspected bridges are independently reinspected. For pavement surface inspection, 10 percent of the surveyed roads are reinspected.
For contracted data-collection efforts, the contractor's data collection and processing are calibrated and validated before a survey. After completing 3,000 km (2,806 mi) of data collection, the contractor is required to recalibrate the vehicle and drivers. Ten sites are selected with a roughness value range between 20 and 180 counts, with test surfaces including both chip seals and asphalt pavement. A minimum of five repeat measurements are taken at each site at nominal speeds of 25, 50, 75, and 100km/h (15.5, 31, 46.6, and 62 mi/h). Test results are required to meet 1) line of best fit falling between 0.95 and 1.05, 2) regression offset of the intercept of line of best fit within -0.25 and +0.25, and 3) an R2 value of at least 0.95.
VicRoads is experimenting with different automated technologies for data collection. For example, it is using ground sensors to provide warnings on unstable slopes. It is also considering using such technologies on structures, as well as experimenting with advanced nondestructive testing methods.
Data-collection schedules for both network condition and performance are shown in table 7.
A recent research project examined community expectations for asset management in relation to pavements, the roadside environment, and bridge maintenance. Researchers interviewed stakeholders, conducted focus groups, and conducted a conjoint analysis that enabled respondents to trade off varying levels of a service delivery within a specific budget level (see textbox).
Public Preferences on Maintenance PrioritiesVicRoads conducted a conjoint analysis to determine public preferences among different maintenance strategies. A total of 360 interviews were conducted in Melbourne of a representative sample of the population. Participants were asked to trade off sums of money among four different maintenance strategies:
Four distinct responses were obtained. About 33 percent of respondents favored increased funding for long-term pavement maintenance, 28 percent favored increased funding for routine maintenance at the expense of other strategies, 19 percent favored both increased routine pavement maintenance and increased roadside maintenance, and 19 percent favored increased routine pavement maintenance and increased bridge maintenance. Turning these desires into utilities for each class of expenditure suggested to VicRoads that an optimum expenditure (from the community's perspective) would be $1 million less on periodic pavement maintenance, $3 million less on roadside maintenance, $2 million less on bridge maintenance, and $6 million more on routine pavement maintenance. For pavement maintenance, respondents preferred expenditures on filling potholes and cracks over other strategies. For roadside maintenance, the top preference was maintenance on signs, guardrails, and footpaths. This was followed by grass mowing and guardrail upgrades. Fifty-five percent of respondents said that Victoria spends “about the right amount” on road maintenance, 42 percent said it did not spend enough, and 2 percent said it spends too much. |
Asset management program priorities are driven by several key factors, including the following:
VicRoads uses simple formulas to determine rankings of different types of projects for given budgets. Sensitivity testing is conducted by changing formula variables. For example, the following formula is used to score projects on the basis of skid resistance measures:
Score = |
K x V x S |
Where: |
V is volume exposed to hazard
|
For conventional rehabilitation projects, the following formula is used:
Rehabilitation project score = |
R*T*L*D/C |
Where: |
R is % roughness > target level (capped at 70%) |
For rural high-speed roads, VicRoads uses the following formula to determine rehabilitation priorities for freight-related projects:
Rehabilitation project score = |
Rfreight * AI * T * L / C |
Where: |
Rfreight is % of sections where the difference in roughness is greater than 1.5 IRI |
VicRoads has a social equity formula that gives the highest priority to roads where 30 percent or more of the individual length to be treated has an average roughness greater than 110 nrm and traffic volumes are less than 500 vpd. Social equity in this case means making sure that low-volume roads do not deteriorate to unacceptable levels simply because they can never reach a volume threshold. The ranking formula for social equity projects is as follows:
Rehabilitation project score = |
Rimprovement * D * T * L / C |
Where: |
Rimprovement is improvement in roughness from the current value to the estimated final roughness. |
VicRoads officials expressed a word of caution about using such formulas. Once those responsible for obtaining maintenance budgets for their district or region know what is in the formula, the formula can be gamed and the data manipulated to show a greater need than actually exists.
Numerous project characteristics are considered when bridge projects are prioritized. These include the strategic importance of the route, functioning of the bridge for all users, freight volume, condition and rate of deterioration, capacity and performance, availability of alternative routes, assessed risks, feedback from users and local communities, cost-benefit ratios, and fit with other strategies and business plans. Asset management is an important part of the process of establishing priorities and is based on a risk management approach. This means projects are assessed in light of competing demands for resources, an understanding of the consequences of not investing in the project, and a prioritized program created to obtain a balanced allocation across all asset needs.
For maintenance, VicRoads' Road Management Plan outlines the process for developing a program. The first step is to conduct a gaps analysis, which entails comparing the latest road condition surveys to maintenance standards and performance targets. A network-level analysis is then conducted to identify appropriate types of strategies that can be applied on the network to fill these gaps. The next step is to develop initial maintenance program targets that reflect likely funding and any changes in road management strategies. The final step is to prepare the maintenance program, which gives priority to routine maintenance, followed by periodic maintenance and rehabilitation. VicRoads' pavement management system provides input into this analysis process.
“It is not appropriate for accounting practices (Australian Accounting Standards) to dictate asset management outcomes.”
— Department for Victorian Communities, 2003
Roadside maintenance projects are prioritized by first meeting statutory responsibilities, then preserving the integrity of the roadside, and finally meeting environmental goals. VicRoads has experimented with pavement deterioration models (dTIMS and HDM-4) in examining combinations of strategic investment and system use scenarios. These experiments were conducted primarily in regional offices to develop regional investment programs. The results of these efforts suggested that the scenario analysis application in the regional offices was time consuming, complex, and difficult to understand. Thus, these tools are now used primarily in the central office as a strategic tool for examining network-level trends.
VicRoads also conducts benchmark studies to compare its program to other Australian states, as well as to examine differences in productivity with different models of service delivery. For example, a comparison was done between contract maintenance versus work done with its own commercialized maintenance group. Costs appeared to be cheaper initially for contract maintenance, but have gone up in recent years. In addition, quality of service could not be benchmarked, although there is a perception that the quality of service is not as good as that provided by VicRoads staff (this could not be verified independently during the scan team's study).
The Victoria government has participated in two major public-private partnerships (PPP) for toll roads over the past 10 years. The experience with these initiatives has been most instructive to the responsible authorities, especially on the role and use of asset management principles and tools in the concessionaire's day-to-day activities.
The first PPP project in Melbourne, the CityLink project, consisted of 19.3 km (12 mi) of new urban freeways including tunnels, elevated roads, and bridges. It was constructed from 1996 to 2000 for A$2.2 billion (US$1.7 billion). Fully dependent on electronic tolling (transponder and video imaging), the CityLink project generates about A$250 million (US$189 million) a year. A concessionaire won the bid to construct, operate, and maintain this project for 34 years. There are more than 950,000 registered e-TAG users, with 750,000 daily transactions. Toll violations are less than 1 percent of daily users.
This project consists of a variety of infrastructure assets, many with very different life cycle characteristics. For example, structural assets have long lives (often 30 years plus), mechanical and electrical systems usually fall into the 10-to-30-year useful life range, and electronic tolling instrumentation has a fairly short useful life, from 3 to 10 years. CityLink estimates that 50 percent of the total life cycle costs of the project are related to repair and maintenance.
CityLink is organized into several divisions or groups, one of which—the Infrastructure Group—is responsible for the owner's (Victoria's) interests and for monitoring performance. These interests were defined as providing travel-time benefits, reliability, and a better road; producing a showpiece asset; maintaining sustained asset performance; assuring an acceptable return on asset investment; assuring safety for users, staff, and contractors; and complying with governance, corporate, and social responsibility mandates. Operations and maintenance activities are outsourced, with about A$20 million (US$15.1 million) spent for both (40 percent for operations and 60 percent for maintenance).
The concessionaire's deed mandates certain maintenance requirements, such as maintaining and repairing promptly, reporting to VicRoads, and responding to notifications of maintenance deficiencies. Maintenance standards are specified for pavements, road markings, lighting, signs, and landscape. The concessionaire is also responsible for meeting handover requirements on facility condition when the road is turned over to VicRoads at the end of the concession deed. For example, the following hand-back conditions illustrate the type of asset requirements that were in the concession deed:
A maintenance plan was part of the concession bid, as was a requirement to show how maintenance management would be undertaken. In the case of CityLink, a computerized maintenance management system (CMMS) was proposed to guide maintenance planning and work allocations, report defects, provide quality assurance reporting, and act as a stores/spares inventory system. Even with these maintenance requirements, the original bid specifications said little about asset management.
To meet the technical requirements and still achieve a desired return on investment over the life of the project, the concessionaire developed a business plan based on risk management. The approach identified the most critical risks to meeting the concession agreement's requirements, designing out defects and inherent faults, replacing worn or troublesome assets that continually fail or cause problems, replacing assets that reduce risk and improve infrastructure investment, replacing assets that are energy inefficient or environmentally unfriendly, and ensuring compliance to the concession deed including meeting specified hand-back requirements. One issue CityLink faced early on was a major failure of a concrete slab in a tunnel because of water filtration. Because the concessionaire accepted facility responsibility as built, the cost of fixing this failure produced a deficit of A$200 million (US$151 million) to the concessionaire at the very beginning of revenue service.
CityLink is now focusing on business-critical systems. According to CityLink officials, the asset management lessons learned from their initial experience with this project include the following: 1) design out defects and faults as much as they are known in the design phase, 2) reduce risk wherever possible, 3) reduce energy consumption, 4) maintain the facility as an evergreen site (that is, do preventive maintenance), and 5) replace troublesome assets as soon as possible. Figures 40 and 41 show how asset management concepts have been incorporated into the business operations of CityLink
Transportation officials learned a great deal from the CityLink experience, especially about asset management. The most recent PPP project, called EastLink, incorporated asset management requirements more comprehensively in the initial bid requirements. The EastLink project consists of 45 km (28 mi) of freeways (39 km (24 mi) tolled) with twin 1.5-km (0.9-mile), three-lane tunnels. The project has a long history of controversy and public discourse, ending up with substantial commitments to environmental mitigation, which were incorporated into the project costs (and, in the process, extending the concession time frame to 38 years to recover these additional costs). Unlike CityLink, a special authority called the Southern and Eastern Integrated Transport Authority (SEITA) was established to oversee this US$2 billion project.
EastLink consists of 17 interchanges, 103 structures (86 bridges), 3 railway crossings, 7 million m3 (9.2 yd3) of earthworks, 2 million m2 (2.4 million yd2) of pavement (asphalt), 150,000 m2 (179,000 yd2) of noise wall face, and 4.7 million plants. Similar to CityLink, the concession assigned risks to several characteristics of the project. The concessionaire was required to maintain, operate, and promptly repair; minimize disruption; and use best practice and continuous improvement strategies. Condition inspections and a requirement of no defects were incorporated into the handover specifications. The concessionaire was required to report residual design life for key assets, and had maintenance obligations for 1) routine maintenance, 2) planned refurbishment, 3) unplanned intervention and repair, 4) inspections, 5) an asset management system and adopted code of maintenance standards, and 6) keeping records and meeting reporting schedules. For operations and maintenance, performance-based terms and conditions were incorporated into the deed. The deed includes for all assets an extensive code of maintenance standards that must be achieved during the life of the concession.
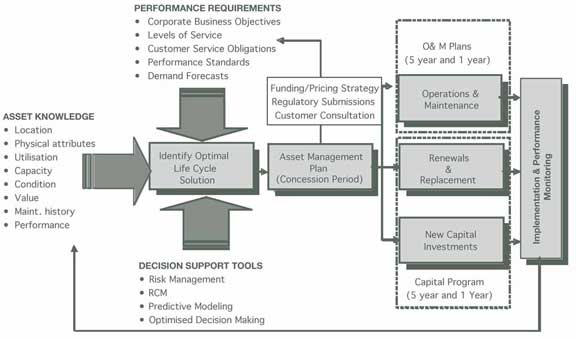
Figure 40.Asset management approach for toll roads in Melbourne.
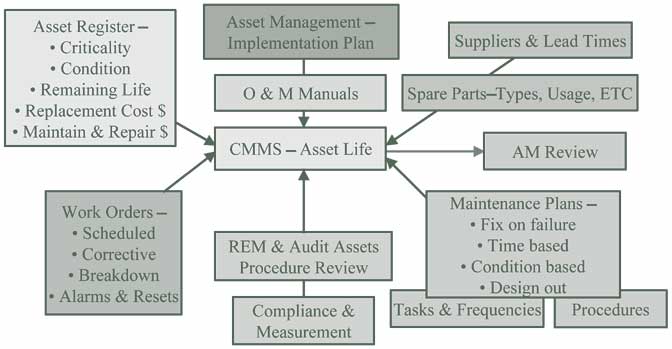
Figure 41.Asset management tools for toll roads in Melbourne.
A bid bond of A$10 million (US$7.5 million) was required for the bid phase, an A$87.5 million (US$66.1 million) bond for the construction phase, and an A$5 million (US$3.8 million) bond building to A$20 million (US$15.1 million) with increasing volumes for the operations phase. A hand-back bond is required that will be agreed to 3 years before the road being is turned back to VicRoads.
The concessionaire must report on a performance indicator regime relating to several performance categories—customer service, road condition, landscaping and features, tolling accuracy, and environmental quality. A monthly scoresheet and a quarterly report on key performance measures are submitted to SEITA. In the event of noncompliance, an A$15 million (US$11.3 million) credit could be provided to road users.
Several aspects of the VicRoads' experience with asset management are noteworthy. The first relates to the recent change in legal nonfeasance that has spurred greater interest in developing a defensible decisionmaking process that the courts would consider reasonable. This legislative change has resulted in activities not only at the state level, but also at the local government level. The fact that more than 60 local governments have opted to have a road information system in place as part of their “reasonable decisionmaking process” gives an indication of the importance liability has in motivating greater concern for asset management.
Victoria, similar to other Australian states, has given much thought to the relationship between performance measures and their role in different levels of decisionmaking in the transportation agency. Performance measures influence everything from strategic decisions to day-to-day maintenance. This consistency in focus provides an important capability showing compatibility with service outcomes and government policies and goals.
Of all the sites visited, VicRoads was probably the most interested in advancing the state of practice in data-collection technologies. Not only has VicRoads adopted high-speed data-collection capabilities, but it is experimenting with smart technologies for collecting data on difficult asset types (e.g., slopes) or in remote locations.
VicRoads has developed several quantitative approaches (formulas) to identify priorities among different maintenance strategies. Only in New Zealand did the scan team observe anything similar. In particular, the team noted that the maintenance rankings included projects oriented toward freight roads and social equity. Although the use of formulas appeared to provide some rigor to the prioritization of work activities, it was noted that the potential for gaming of the formula could lead to inefficient budget allocations.
One of the most interesting observations in Victoria related to the role of asset management in PPP projects. Because Victoria has had several years of experience with PPP projects, lessons learned from this experience can be important for others contemplating this direction for infrastructure investment. Put simply, great care should be given to making sure that the concessionaire becomes committed to asset management as part of the business decisionmaking process. The first project in Melbourne did not include asset management in its specifications as much as the second project has. This was the direct result of the learning process that transport officials went through in both projects.
[31] For a complete list of Treasury documents on asset management see http://www.dtf.vic.gov.au/dtf/rwp323.nsf/search/D62EBFC40F8477C805256A9A00726104?opendocument&Expand=7.2&.
[32] See VicRoads, “Road Management Act, Regulations and Codes,” http://www.vicroads.vic.gov.au/vrne/vrne5nav.nsf/childdocs/.
[33] VicRoads, Road Management Plan, Melbourne, VIC, Oct. 2004, see http://www.vicroads.vic.gov.au/vrne/vrne5nav.nsf/8020?readform=&layout=VicRoads2005%7ESearch&query=Road+Management+Plan.

