U.S. Department of Transportation
Federal Highway Administration
1200 New Jersey Avenue, SE
Washington, DC 20590
202-366-4000
Transit New Zealand—www.transit.govt.nz
Infrastructure Managed
|
New Zealand has been a world leader in many aspects of road network management. In asset management, New Zealand has implemented innovative performance-based maintenance contracts, established a performance-oriented asset management decisionmaking structure, and is the home of one of the most active local government and professional association-supported programs for furthering asset management goals.
Two national agencies have primary responsibility for New Zealand's transportation system (see figure 7). Transit New Zealand (Transit NZ)[15] manages a 10,836-km (6,733-mi) national road network, constituting 11.5 percent of the length of New Zealand's roads. This national road network handles about 50 percent of the total vehicle-kilometers traveled each year in the country. Land Transport New Zealand (Land Transport NZ) funds police, safety programs, and public transportation. Transfund, part of Land Transport NZ, is the major source of funds for highway investment and a critical player in establishing transport priorities. According to New Zealand's Transport Strategy, Land Transport NZ's focus in its investment is on “improving system management, promoting alternative modes of transport, reducing reliance on motor vehicles, improving energy efficiency, and reducing adverse effects of transportation system use.”[16]
Both agencies operate under national legislation that emphasizes not only an important role for transportation in moving people and goods, but also the critical linkages between transportation system performance and other national goals. For example, a recent law required government agencies to reexamine their operations to determine how they can better create a sustainable New Zealand. As a consequence, Transit NZ has adopted a mission statement that states that its responsibility is “to operate the state highway system in a way that contributes to an integrated, safe, responsive and sustainable land transport system.”[17]
It is important to note that the transportation agencies in New Zealand compete with other nongovernmental programs for resources (except for revenues dedicated to transportation). This whole-of-government context places even greater importance on transportation agencies to justify their funding requests.
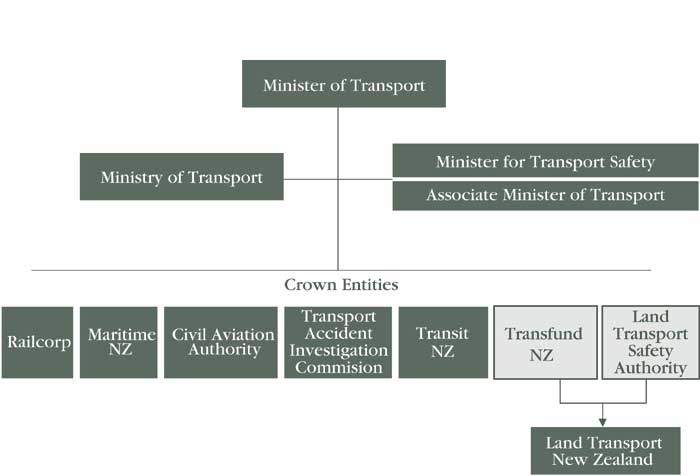
Figure 7.Organizational structure for transportation in New Zealand.
Transit NZ officials identified several challenges facing the country's transportation system. New Zealand faces increasing growth on the transportation system that far outpaces the addition of new capacity, both in passenger and freight movement. This is especially true in Auckland, the country's largest metropolitan area. In addition, the pavement replacement schedule is not meeting deterioration rates, and Transit NZ has found that some structures are not lasting as long as expected. The country also faces shortages in professional staff and construction/maintenance resources (all system operations and maintenance are outsourced to private firms).
Officials also stated that New Zealand has been fortunate that its pioneering history was based on lightweight and temporary construction, which ingrained a maintenance-first mentality into the culture. However, the officials admitted that it is becoming more difficult to convince elected officials of the desirability of this philosophy in light of demands for new infrastructure to match the rapidly escalating demand.
Asset management has occurred in New Zealand for several reasons. First, a national law requires all government agencies to value the national assets under their jurisdiction. For the national highway network, the required valuation outputs are the replacement cost and depreciated value of the network. These are estimated annually on a regional basis with the results aggregated to a national total for the state highway network.
Second, the stewardship mentality found in great abundance in New Zealand for its natural resources is also found in the governmental perspective on its responsibilities to the people of New Zealand. Maintaining a functioning transportation system at desired levels of service is part of the governmental ethic guiding planning and decisionmaking. An asset management program was considered part of the management support structure that would achieve such stewardship. The Land Transportation Management Act of 2004 has also added a new twist to this stewardship role. By adding sustainability to Transit NZ's objectives, asset management takes on an environmental quality element as well. The objectives are as follows:
Third, given that maintenance activities on the national road network have been privatized, Transit NZ realized that managing this type of program delivery, and in particular determining the right mix of activities, required good information on the performance and condition of the network. About two-thirds of these 5- to 10-year contracts are performance based. This strategic program perspective has led to increased interest in a comprehensive asset management effort.
A final driver for asset management in New Zealand is a consortium of national and local government associations and consultants called the National Asset Management Steering committee (NAMS), which was formed in 1995 to champion asset management. This group has played an important role in fostering improvements to asset management practice in New Zealand and through its publications in other parts of the world (see Chapter 5 for more discussion of NAMS).
Transit NZ is organized into four major groups/divisions, an organizational structure replicated in the regional offices—transport planning, network operations (where the asset management responsibility lies), capital projects, and organizational support. Within this structure, the agency has defined different job positions with asset management responsibilities. About 50 people nationwide have responsibility for asset management, including those in Transit NZ's regional offices. Appendix C includes three job descriptions for asset management-related positions.
One of the scan team's important observations on how asset management is organized in New Zealand is that it is part of the strategic planning, performance monitoring, and accountability structure established in all levels of government. Transit NZ and Land Transport New Zealand, for example, follow asset management guidance found in numerous plans, manuals, and statements of policy. The New Zealand case, perhaps more than any others, showed a much higher level of integration of asset management concepts and principles into the day-to-day activities of the transportation organizations.
Reliance on outsourced maintenance service delivery also has had an impact on Transit NZ. Initially, the philosophy was that outsourcing allowed the client to significantly downsize and down skill. Perhaps inevitably, this has been found not to be so and Transit has had to rebuild the skill base, but for different functions (specifying performance, auditing, and interacting with its suppliers to achieve better outcomes). Overall, the human resources required to deliver the total package has been significantly reduced.
Contractors are required to maintain their own performance audit systems (open to review by Transit NZ); Transit NZ audits about 5 percent of the network to assure quality performance. If the performance is acceptable, determined at regular (at least annual) reviews, the contractor is provided first right of refusal for all work within his network up to a project value of some NZ$400,000 (US$280,000). This is a relaxation of normal competitive pricing rules to gain efficiencies of an established contractor who knows the network, has a team in place, and can offer good prices on the basis that it has up to 10 years' work secured through the maintenance contract. Eligible contractors usually end up undertaking all of the minor capital works projects in their network as well as the maintenance activities outside of the lump-sum maintenance contract (for example, major drainage work). All contractors are expected to be ISO 9000, or equivalently, certified. Each region also has a consultant contract to help monitor and supervise service delivery either within the contractor team for 10-year contracts or employed by Transit New Zealand for 5-year contracts.
The human resource element is another important aspect of organizing for asset management. Transit NZ conducts an annual asset management workshop, holds training seminars when new approaches or policies occur, supports conferences and technology seminars, and participates in local asset management forums with 72 local authorities. Regional network operational managers meet every 2 to 3 months to exchange information and experiences. Even more impressive are the activities of various local governments and professional organizations in furthering asset management principles. This is discussed in further detail in Chapter 5.
Transit NZ is also a major participant in the research efforts of Austroads, the association of Australian and New Zealand road transport and traffic authorities, as they relate to asset management. This research focuses on pavement failures, levels of service, and cost models.
Decisionmaking in the New Zealand transportation agencies is guided by several tiers of planning activities conducted annually[18] At the strategic level, agencies must prepare a statement of intent that identifies proposed investment activities over 3 years, including how such investment will achieve performance targets. Each agency also has a strategic plan, updated every year, that links adopted transportation goals to key result areas and agency activities. A national state highway strategy defines the capital and preservation strategies that will be used to meet adopted goals and performance targets. A network statement is also prepared for each of 25 contract areas that includes the following information on each infrastructure network: network description, overview of condition, issues/goals, performance measures and triple bottom-line reporting, asset management practices and strategies, current contractual commitments for maintenance, safety impacts, performance targets, a 10-year works program based on modeling (including pavement deterioration), and a description of any new initiatives. Performance agreements are also signed between the agencies and the responsible party (in this case, the Minister of Transport) that spells out how performance will be measured in the coming year.
At the more tactical level, network annual plans (again for the 25 contract areas) are prepared. (Regional networks range from 200 km (124 mi) to 700 km (435 mi) long). These annual plans are aggregated to form a national operate-and-maintain plan. These annual plans, based on levels of service, include funding requests; demonstrate delivery/historic trends, network condition, and future strategies; and provide justification for investment (for maintenance, this is often linked to the national asset management plan discussed below). Levels of service are defined by road type, usually tied to volume, (e.g., greater than 10,000 vehicles a day, 10,000 to 4,000 vehicles a day, 1,000 to 4,000 vehicles a day, and less than 1,000 vehicles a day). Every asset has associated level-of-service measures. If the budget for a particular asset category is cut, these level-of-service measures are revisited.
Most important from the perspective of asset management, Transit NZ uses a National Asset Management Plan (AMP) to guide transportation asset-related planning and resource allocation decisions (the latest version was in draft form at the time of the scan team's visit). This plan is instrumental in establishing the process and substance of asset management at the national level in New Zealand. Figure 8 shows the asset management process described in this plan. The AMP is organized in the following sections:
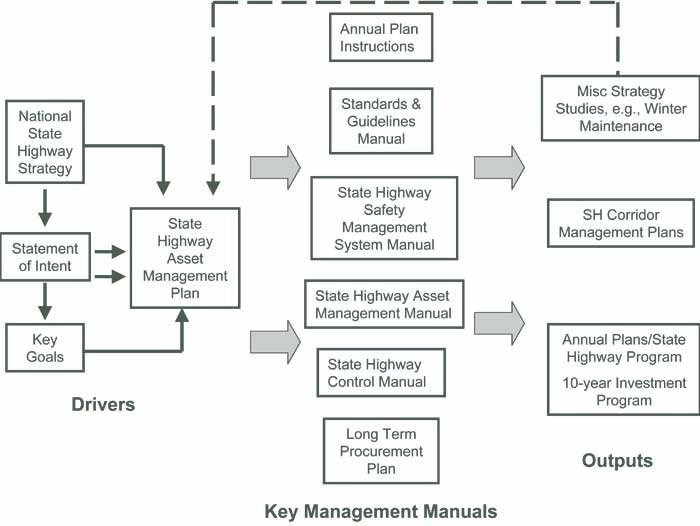
Figure 8.Transit New Zealand's asset management process.
The draft national operate-and-maintain plan to meet agreed levels of service is discussed and negotiated with Land Transport NZ. The effects of funding less than what the draft plan requires are discussed. The final funding reflects the balance between available funding and the need to maintain service levels. Land Transport NZ is also the source of funds for police and public transport activities, so the existence of the asset management plan is viewed as an important basis for justifying budget requests.
Transit NZ is also incorporating asset management concepts into other activities and planning efforts. For example, given the government's emphasis on sustainability, Transit NZ has developed a new agency environmental plan, which is closely integrated with asset management. The types of asset management activities included in this plan are as follows:
The decisionmaking process for determining priorities is based on whole-of-life costing (known in the United States as life cycle costing) procedures, which includes deterioration modeling to determine useful lives. Whole-of-life costing considers all costs over the lifetime of an asset, discounted to the present. Given defined levels of service for each maintenance activity, a gaps analysis is used to determine maintenance needs.
Figure 9 illustrates the relationships among the many different components of the asset management decisionmaking process in New Zealand.
For funding priorities, Land Transport NZ uses a six-step allocation process as its primary decision support framework for making tradeoffs among many different projects. The National Land Transport Programme (NLTP), produced annually, covers funding for local roads, state highways, passenger transport, and other activities (in addition to its safety and police funding). It also includes a 10-year financial forecast. About 52 percent of NLTP funding goes to support the state road network and 30 percent to local roads. Of the total NZ$1.16 billion (US$812 million) allocated in the 2004/05 NLTP budget for state and local roads, about NZ$300 million (US$210 million) goes to maintenance of the State Highway network (another NZ$300 million goes to subsidize local road maintenance).
Performance measures and indicators are found at all levels of planning and decisionmaking in New Zealand (see figure 10). At the strategic management level, such measures and indicators are defined in the Statement of Intent, where targets are set at the start of each year and reconfirmed at midyear. An annual report shows progress on these indicators and presents information on the economic, environmental and social goals that constitute the triple bottom line. It also includes a pavement condition report that includes measures relating to roughness, rutting, texture, and skid resistance. Operational performance measures cover issues such as availability of the network, level of congestion, safety, and response times. Financial information is also presented for program progress and delivery accountability. In addition, a monthly traffic light report presents progress reports against key performance measures in the form of a green (okay), yellow (warning), and red (action required) color scheme. At each level, performance is measured in both absolute terms and trends.
Transit NZ also collects information on user satisfaction with the road network. For maintenance and asset condition, it has established a target of 90 percent of road users rating their satisfaction with the road network as good or above. The road characteristics included in this survey are traffic flow, road safety, road surface, road marking, road signs, rest areas, and quality of the roadside environment.
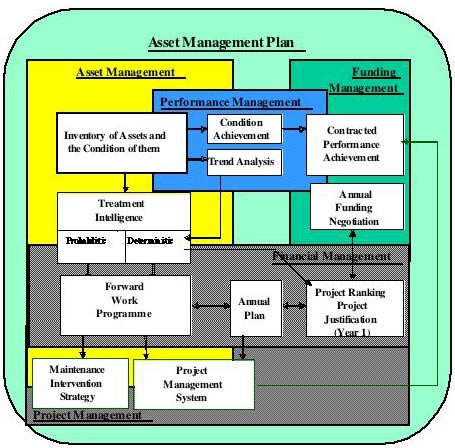
Figure 9.Business model of asset management in New Zealand.
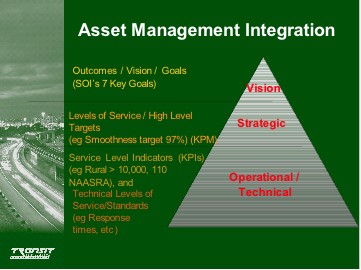
Figure 10.Use of performance measures in Transit New Zealand.
At the network level, Transit NZ reports on numerous performance measures and indicators. An annual high-speed network condition survey provides input into key performance measures (KPMs) and key performance indicators (KPIs). An example of the type of information reported is shown in figure 11. Project-level performance measures include levels of service, pavement condition, and maintenance response times. Similar measures are incorporated into maintenance contracts covering network condition, operations, and system management. These measures govern what happens in the contracted service delivery. These measures are aggregated and combined with other data to produce a whole-of-network picture.
Levels of service are defined for each work activity in the asset management plan. These levels of service were determined from historical trends and through a Delphi process with agency staff and other professionals, and with community input. Levels of service are also defined for each maintenance activity and used to support funding applications to Land Transport NZ. These levels of service not only serve as the basis for performance reporting, but they also serve as the inputs into maintenance performance contracting. Transit NZ learned many years ago that a smaller, more targeted number of performance measures is most useful to the agency. When the agency started using performance measures, it began with 230 measures. This was pared down to 32 when Transit NZ officials realized that 230 measures were too difficult to comprehend. Because of environmental and sustainability concerns, the number of measures now approaches 70.
Figure 11. Network rutting reporting in New Zealand.Table 4 illustrates the type of asset management data presented to senior agency officials in various documents.
Land Transport New Zealand heavily depends on level-of-service measures when establishing funding priorities. For example, the latest guidelines to authorities in developing the Land Transport Program included the following types of maintenance measures that funding submitters should consider:
Road User Satisfaction Measures
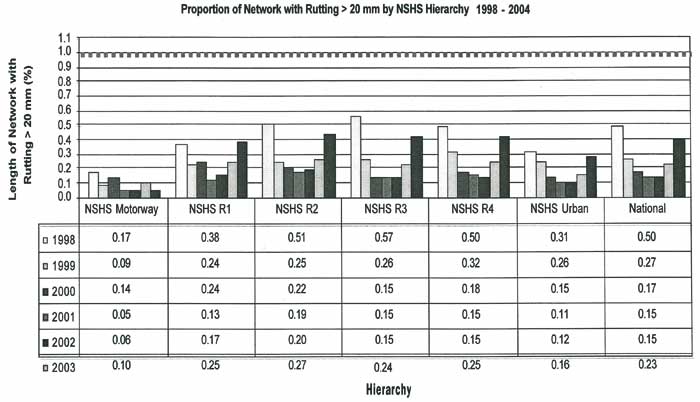
Figure 11.Network rutting reporting in New Zealand.
| Measure | 2002/03 Actual |
2003/04 Target |
2003/04 Actual |
|---|---|---|---|
| Percent | |||
Percentage length of network with current state highway plan |
93 |
85 |
88 |
| Maintenance Measures | 2000/01 | 2001/02 | 2002/03 | 2003/04 |
|---|---|---|---|---|
Expenditure ($ millions) |
NZ$242.9 (US$170) |
NZ$247.6 (US$173) |
NZ$273.5 (US$191) |
NZ$285.3 (US$200) |
Total VKT (VMT) in 100,000s |
16,977 (10,550) |
17,571 (10,919) |
18,061 (11,223) |
18,681 (11,608) |
Expenditure per 100,000 VKT (VMT) |
NZ$14,310 (US$16,114) |
NZ$14,090 (US$15,844) |
NZ$15,140 (US$17,019) |
NZ$15,272 (US$17,229) |
Percentage change per 100,000 VKT or VMT |
-6.0 |
-1.5 |
+7.5 |
+0.8 |
| Total Asset Value | 2000/01 | 2001/02 | 2002/03 | 2003/04 |
|---|---|---|---|---|
| NZ$ (US$) in millions | ||||
Depreciated Replacement Cost |
NZ$11 (US$7.7) |
NZ$12 (US$8.4) |
NZ$12.5 (US$8.7) |
NZ$13 (US$9.1) |
| Expenditure | 2003/04 Budget | 2003/04 Target | 2003/04 Actual | (2003/04 Revised Feb) | (2003/04 Revised June) |
|---|---|---|---|---|---|
| $NZ ($US) in millions | |||||
Maintenance |
320.3 (224) |
|
327.4 (229) |
321.1 (224.7) |
331.2 (231.8) |
| Percent | |||||
102.2 |
98-102 |
|
102 |
98.9 |
|
| $NZ ($ US) in millions | |||||
Replacement and Improvement |
340.7 ($238) |
|
360.3 ($252) |
322.6 ($226) |
355.9 ($249) |
| Percent | |||||
105.8 |
Less than 103 |
|
111.7 |
101.2 |
|
| Description | 2003/2004 Target | 2004/2005 Target | 2005/2006 Target | 2006/2007 Target |
|---|---|---|---|---|
Variance in percentage terms between forecast and actual dollar expenditure on state highway maintenance program at February review |
98-102 |
98-102 |
98-102 |
98-102 |
Periodic Maintenance
|
97.5-102.5 |
97.5-102.5 |
97.5-102.5 |
97.5-102.5 |
Levels of Service
|
97 |
97 |
97 |
97 |
| Description | Unit | 2001/02 Actual | 2002/03 Actual | 2003/04 Target | 2003/04 Actual |
|---|---|---|---|---|---|
Cost |
$NZ ($US) millions |
105.6 ($74) |
119.8 ($84) |
127.6 ($89) |
126.8 ($89) |
Length |
km (mi) |
10,783 (6,700) |
10,786 (6,702) |
10,798 (6,710) |
10,837 (6,734) |
Unit Cost |
$/km ($/mi) |
9,795 ($11,045) |
11,107 ($12,534) |
11,817 ($13,264) |
11,701 ($13,216) |
| Description | Unit | 2001/02 Actual | 2002/03 Actual | 2003/04 Target | 2003/04 Actual |
|---|---|---|---|---|---|
Cost |
$NZ ($US) millions |
68.9 ($48) |
74.3 ($52) |
77.1 ($54) |
73.2 ($51) |
Length |
km (mi) |
1,298 (807) |
1,328 (825) |
1,450 (901) |
1,231 (765) |
Unit Cost |
$/km ($/mi) |
53,106 (59,480) |
55,949 (63,030) |
53,172 (59,933) |
59,464 (66,667) |
| Description | Unit | 2001/02 Actual | 2002/03 Actual | 2003/04 Target | 2003/04 Actual |
|---|---|---|---|---|---|
Cost |
$NZ ($US) millions |
73 ($51) |
79.4($56) |
82.7($58) |
85.3($60) |
Length |
km (mi) |
10,783 (6,700) |
10,786 (6,702) |
10,798 (6,710) |
10,837 (6,734) |
Unit Cost |
$/km ($/mi) |
6,768 ($7,612) |
7,361 ($8,356) |
7,659 ($8,644) |
7,871 ($8,910) |
| Description | Unit | 2001/02 Actual | 2002/03 Actual | 2003/04 Target | 2003/04 Actual |
|---|---|---|---|---|---|
Cost |
$NZ ($US) millions |
4.3 ($3.0) |
5.2 ($3.6) |
5.8 (4,0) |
5.4 (3,8) |
| Description | Unit | 2001/02 Actual | 2002/03 Actual | 2003/04 Target | 2003/04 Actual |
|---|---|---|---|---|---|
Cost |
$NZ ($US) millions |
8.2 ($5.7) |
9.1 ($6,4) |
9.3 ($6,5) |
10.2 ($7,1) |
Asset Value |
$NZ ($US) millions |
341 ($239) |
445 ($312) |
360 ($252) |
545 ($382) |
| Description | Unit | 2001/02 Actual | 2002/03 Actual | 2003/04 Target | 2003/04 Actual |
|---|---|---|---|---|---|
Cost |
$NZ ($US) millions |
18.3 ($12.8) |
15.3($10.7) |
17.8 ($12.5) |
26.5($18.6) |
Road Safety Measures
Asset Preservation Measures
In an overview document targeted at maintenance activities, Land Transport New Zealand identified several measures that were particularly important, including smooth travel exposure, a sealed road condition index, and a pavement integrity index.
Transit NZ has a suite of asset information systems used in providing information to the decisionmaking and prioritization process (see figure 12). The Road Asset Maintenance Management (RAMM) system, begun in the 1980s, includes the primary road inventory, condition data, and treatment selections and interfaces with the pavement design system. It is used by Transit NZ staff and consultants, and can be used as a distributed system. Seventy-two local authorities also use this system. The National Optimization of Maintenance Allocation by Decade (NOMAD), a module of RAMM, develops a 10-year program of investments by treatment type. A pavement modeling tool, dTIMS, uses deterioration modeling to predict future pavement condition (there are 85 dTIMS licenses in New Zealand, but not all license holders use the software). In this application, the road network is segmented into like-performing roads and appropriate treatments are identified for different performance levels.
Transit NZ's Traffic Monitoring System (TMS) includes five weigh-in-motion sites (dial up and noncontinuous), 70 continuous traffic count sites, and 1,000 noncontinuous traffic count sites. TMS is used primarily for reporting traffic volumes and trends in growth and weight, and for enforcing truck weight restrictions. A bridge information system is available, but it is not as developed as RAMM. It consists simply of an asset register of bridge structures (BDI), a bridge structural index (BSI), and an overweight vehicle management system (Transit Overweight Permitting System (TOPS)). When combined with bridge management consultants, this relatively unsophisticated system has proved capable of managing the bridge stock. Transit NZ is developing a more sophisticated overweight vehicle management system to rectify some shortcomings in TOPS and giving some thought to more integrated bridge management systems. RAMM also includes a traveler information system (0800) and a limited-access road database (LAR) for planning purposes.
Transit NZ is implementing a Location Referencing Management System with spatial capabilities designed to provide a more integrated database approach to future asset management activities. The desire is to integrate the process of information production, not develop one comprehensive database. Figure 12 also shows the future relationships that the referencing system will provide.
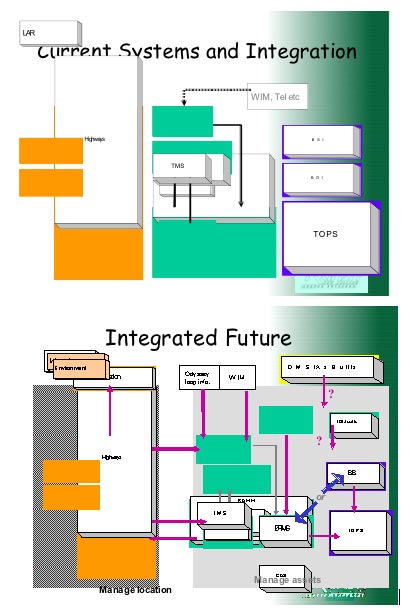
Figure 12.Current and future systems configuration at Transit New Zealand.
Pavement condition data drive the performance measurement process. Data are collected both visually on 10 percent of the road network each year and across the whole national network with a high-speed data-collection vehicle called a Sideways-Force Coefficient Routine Investigation Machine (SCRIM). This vehicle collects data at 10-m intervals for skid resistance, rutting, roughness, and texture and videotapes the network. These data are measured in both wheel paths to allow a comparison across the entire paved surface. The high-speed data collection occurs via private 3-year contracts (valued at NZ$1 million (US$700,000 a year), and covers about 22,000 lane-kilometers (13,670 lane-miles) each year. Tendering is on the international market and is now sourced from the United Kingdom.
Pavement strength data are collected with a falling weight deflectometer at 200 m. These data are collected via private contractor on highways with over 2,000 average annual daily traffic (AADT), and cover about 10,000 lane-kilometers (10,900 lane-miles) each year (or once every 3 years). Roughness is defined at 100-m (109-yd) and 20-m (21.9-yd) sections, rutting at 20 m (21.9 yd), skid resistance and rutting at 10 m (10.9 yd), and geometry at 10 m (10.9 yd). To calibrate this data-collection activity, Transit NZ uses 52 calibration sites throughout the country. A walking profilometer is used to validate IRI measurements.
Transit NZ also collects data from transportation users. Surveys of road users occur every 2 to 3 years. Focus groups also have been used. In response to survey information, Transit NZ has placed greater emphasis on providing more passing lanes and improving sections of road with the highest level of roughness (of concern to truck drivers). In addition, a NZ$12 million (US$8.4 million) to NZ$15 (US$10.5) program over 3 years was implemented to fix undulations in road vertical profiles, which the trucking industry had identified as a problem to truck ride quality. As Transit NZ officials noted, one challenge of this type of data is relating varying levels of user satisfaction to the service levels Transit NZ provides.
Land Transport NZ does not propose projects, but instead reviews project requests. The funding priorities are determined by relating proposals to legislative requirements, including sustainability, economic development, safety, access and mobility, public health, and environmental quality. In early 2002, the government established specific priority areas for targeted land transport funding: severe congestion, public transport, walking and cycling, regional development, alternatives to roads, and safety. The government continues to identify key issues. Regional strategies that are part of transport plans are also important justifications for project priorities. For new capital projects, the seriousness and urgency of the need, the project's effectiveness, and a benefit/cost ratio must be provided. Projects are rated as high, medium, or low priority. Given recent changes to legislation, Land Transport NZ officials believe that the quantitative thresholds for project justification might be lowered to account for factors not easily quantified, such as sustainability.
Maintenance has historically received first priority in Land Transport NZ's prioritization scheme. Approved organizations (i.e., local authorities and Transit NZ) must prepare asset management plans, and present annual statistics that indicate changes in the asset base, network status as it relates to performance measures, and work achieved. Instructions to the approved organizations are issued early in the previous fiscal year and cover the type of information and analyses desired. Maintenance funding priorities are based on historic costs, trends in network condition, benchmarking with other organizations, links to national objectives, and relationship to the asset management plan. Land Transport New Zealand places a great deal of emphasis on asset management planning, and it expects robust asset management practices to include complete inventory databases, optimized decisionmaking, life cycle strategies, long-term planning, level-of-service outcomes, and linkage to national and regional strategies.
“We need effective processes in place so that we can be confident of identifying and managing significant risks to our business. . . . Better decisions, processes, plans, and programs are the intended results. The goal is to enhance our chances of success and to minimize the potential for failure through greater risk awareness and proactive management.”
— Risk Management Process Manual, Transit NZ, 2004
At the national level, Transit NZ uses a whole-of-life costing procedure to determine net present values of proposed projects (using a 10 percent discount rate). If the cost of the project is more than 10 percent of this value, it is elevated to the status of a reconstruction project. All projects must be justified, either by a benefit-cost ratio for capital projects or some other form of justification for smaller projects (e.g., least-cost analysis for renewals compares ongoing maintenance costs against replacement cost).
Scenario analyses of alternative budget assumptions and corresponding performance levels are conducted using dTIMS.
Transit NZ has developed an Asset Valuation Manual that defines the approach for valuing different assets (one-third of the network is revalued each year), calculating replacement costs (see table 5) and identifying remaining service life. Life cycle costs are assumed over 25 years for pavements, and pavement design life is assumed to minimize whole-of-life costs. Transit NZ officials had concerns about the concept of remaining service life. Questions they are struggling with include the following: When is structural integrity compromised, and thus the end of useful life? For assets such as ITS equipment, how does one determine remaining useful life? As a performance measure, remaining service life becomes a check on contractor maintenance strategies. Transit NZ can determine, for example, if contractors are avoiding more costly maintenance and using up the structural life of the pavement. The measure for pavement replacement cost is based on the depth of granular overlay that would bring the pavement up to a 25-year remaining life.
Transit NZ depends on its regions and network service areas to develop plans and priorities for the networks for which they are responsible. Two such plans were reviewed for this report, Hawke's Bay Network Management Area and PSMC001 Network Management Area. In both cases, analysis was done on network characteristics relating to skid resistance, texture, pavement roughness, rutting, and granular overlay deficit. Other measures relating to safety and social/environmental factors were also discussed. These plans then examined maintenance needs and recommended treatments.
The New Zealand case provides an excellent example of a national government that has used using performance-based planning, operations, and maintenance for many years and has now integrated asset management into this mix. The investment program of Transit NZ (and of other agencies as well, such as the Land Transport NZ's financing decisions) is tied very closely to the government's policies and mandates. These agencies use performance measures to assure consistency in agency action at all levels of decisionmaking. This occurs not only at the strategic level, but also in the contracts used to provide maintenance services. This hierarchy allows a buildup of information from the most local level to a national perspective on the progress being made. New Zealand transportation officials have thought carefully about where asset management fits into the total business activities of their organization, not just the obvious ones of maintenance and preservation. The linkage between asset management and Transit NZ's environmental plan is an example of this, even though it is in its infancy.
One does not need to outsource service delivery to have a strong asset management program. However, the New Zealand case does suggest that the opposite is true. Outsourcing service delivery requires a strong asset management program. Such a program provides some assurance that the agency is doing the right things, and that through performance monitoring, progress toward overall goals can be determined. One consequence of outsourcing for Transit NZ was a reduction in the number of staff. However, staff levels have increased because of the need to monitor the contracted service and provide strategic direction. Not only have the number of staff gone up, the skill set has changed for these new staff members.
The Land Transport NZ approach to budget allocation provides an interesting example of tradeoff analysis among different budget categories at a general level. Land Transport NZ provides applicants very detailed instructions on the information required for their proposals, with common measures across different asset types. Priorities are set by how well a project makes its case for national funding. For capital projects, this usually entails a benefit-cost analysis. For maintenance projects, this requires a stronger linkage to systematic and comprehensive examinations of the problems focused on (e.g., linking a request to the asset management plan).
Because of legislation and regulation, asset management plans are required for agencies seeking funding from the national government, including Transit NZ. These asset management plans provide a strategic perspective of the problems, the types of strategies appropriate for different types of problems, and a process for determining the best mix of strategies. The concepts embedded in these plans are also incorporated into regional network plans, resulting in consistency across the country. The network management plans reviewed for this case (and these were small areas compared to typical U.S. jurisdictions) were more comprehensive than found in most U.S. jurisdictions. They were succinct, targeted, and focused on system performance.
Information systems serve as the decision support foundation for asset management. These systems, in turn, depend on the quality and efficiency of the databases that support them. Over time, Transit NZ has developed a set of good asset management systems (although the structures are behind pavements) that are now linked via a locational referencing system. With a common reference base, Transit NZ can obtain much more useful information while using existing databases.
Transit NZ has applied innovative methods to obtain public input into its asset stewardship role. Focus groups have been used to identify perceptions and desires of the community on asset management, and targeted outreach efforts have been used to solicit user input. A good example of this latter effort was the trucker input on ride quality.
Finally, New Zealand has one of the most comprehensive and institutionally supported asset management user groups in the world. The National Asset Management Steering (NAMS) Group is a support structure for asset management that plays an important educational and training role in New Zealand. It has developed several how-to manuals that have become important resources worldwide. Chapter 5 has more information on NAMS.
Words of Wisdom and ExperienceBased on many years’ experience with performance-based decisionmaking and asset management, Transit New Zealand officials offered many observations of benefit to others:
|
[15] Note that the word “transit” in this case does not mean public transportation; Transit New Zealand is the agency responsible for the national strategic road network in New Zealand.
[16] See http://www.beehive.govt.nz/nzts/downloads.cfm.
[17] See http://www.transit.govt.nz/about_transit/index.jsp.
[18] See the following website for copies of Transit New Zealand's publications, http://www.transit.govt.nz/news/index.jsp

