U.S. Department of Transportation
Federal Highway Administration
1200 New Jersey Avenue, SE
Washington, DC 20590
202-366-4000
Two of the sites the scan team visited represented asset management experience at the national government level. As might be expected, not only do national agencies have their own responsibilities for managing assets (e.g., road networks), but they also play an important role in educating, guiding, and in some cases mandating asset management practices to other governments. The scan team's two national experiences with asset management were those for England and New Zealand.

Highways Agency—www.highways.gov.uk
Transportation Infrastructure ManagedBy Highways Agency (Strategic Roads in England)
|
England is a world leader in transportation, known for having one of the lowest road fatality rates of any country in the world as well as for applying innovative technologies and methods for managing its infrastructure. The road network in England can be considered in two parts. The strategic or national network is managed by the Highways Agency and the nonstrategic, or local, network is managed by local authorities. Although England has initiated important processes and procedures for asset management, it still has important challenges in improving the condition of the road network. A recent trend in major road deterioration was halted only in 2004 when significant funding was allocated to maintenance for this part of the network. Today, on local roads, almost 4,000 bridges still need strengthening and 2,844 need major maintenance. About 32 percent of England's lighting columns are more than 30 years old, their expected useful life.
One reason for this state of affairs is that local governments (of which there are 150 in England) are responsible for a large portion of the road network, but the funds they receive from the national government ostensibly for transportation purposes can be used for any governmental purpose. Not surprisingly, given strong public pressures for quality education and social services, some of this funding is allocated to nontransportation activities (an estimated 8 percent of the national funding allocation).
At the national level, the Highways Agency of the Department for Transport is responsible for England's major roads. This includes about 7,754 kilometers (km) (4,818 miles (mi)) of major arterial roads, carrying 25 percent of England's traffic volume and 50 percent of its heavy vehicle movements. One interesting aspect of the Highways Agency's road network is that, unlike other countries the team visited, the mileage for which the Highway Agency is responsible has decreased each year over the past decade because the agency has been turning roads and bridges back to local governments (referred to as “detrunking”).
The agency's annual budget is £5.5 billion (US$11 billion), with about £850 million (US$1.7 billion) going for road maintenance. The Highways Agency Business Plan for 2005/06 states that £2.5 billion (US$5.0 billion) has been allocated over the next 3 years for road maintenance.
“Many people think asset management is just a fancy term for maintenance...it isn't.”
--Maintenance concessionaire
The road network is divided into 14 operational areas with each area managed by a managing agent, (MA) a private consultant usually operating under a 5-year contract. There are two forms of MA. In the first form, the consultant is a separate organization from the contractor carrying out the maintenance for the area. In the second form, the area is managed and maintained by a company that combines the managing consultant with the maintenance contractor. The agent for the second form is known as a managing agent contractor (MAC). These managing agents are an important implementing structure for the Highways Agency's asset management program. England has also been divided into four traffic operations regions.
The Highway Agency's stated aim is “Safe roads, reliable journeys, informed travellers,” with the following specific objectives:[3]
As the list shows, asset management is not a stated objective of the Highways Agency. This is in part because of its view of itself as a traffic service provider, as well as its philosophy that asset management is engrained into all of the agency's functions.
The strategic planning guidance for 2006 and beyond lists the following priorities for the road network:[4]
Highest Priorities
Given the tremendous backlog in maintenance on local roads that accrued over the past decade (estimated at £3.75 billion (US$7.5 billion)), the national government set targets to halt the decline in local road pavement condition by 2004 and to eliminate the backlog by 2010. Eliminating the maintenance backlog was a policy objective that local transport officials mentioned continually during the scan team's visit. Highways Agency officials stated that no maintenance backlog for road pavements exists on the national network, but they believed a backlog exists for local road maintenance.
One of the most important drivers for asset management in England has been governmental directives on transport policy and accounting procedures. A tradition of managing road assets began in 1825 when Parliament stated that it was government's “duty to maintain” infrastructure built with public funds. The more recent evolution in asset management is best explained by examining governmental policies and procedures occurring over the past 10 years.
The national government published a white paper in 1998 entitled A New Deal for Transport: Better for Everyone and a report called A New Deal for Trunk Roads in England. Three major investment areas were identified in these reports—maintenance, operations, and capital improvement—along with investment criteria on safety, environment, economy, accessibility, and network integration. They also identified new directions for the Highways Agency, one of which was to "give priority to the maintenance of trunk roads and bridges with the broad objective of minimizing whole life costs."
A Local Government Act of 1999 defined governmental responsibility as stewards of public funds as being a “general duty of best value.” A best-value authority must “make arrangements to secure continuous improvement in the way its functions are exercised, having regard to a combination of economy, efficiency and effectiveness.” This act was preceded by a Compulsory Competitive Tendering (CCT) policy, which required local authorities to follow certain processes when delivering its services, thus leading to increased privatization of service delivery. This also changed the bid selection process from low bid to best value.
This concept of “best value” has found its way into many technical guidelines and processes. For example, Delivering Best Value in Highway Maintenance, published by the Institution of Highways and Transportation, is what is called a “code of practice” for maintenance management.[5] In this document, the key principles of asset management are defined as follows:
The code clearly places asset management at the center of guaranteeing best value in the road sector.
A Transport Act of 2000 gave local authorities a statutory requirement to produce local transport plans (LTPs) covering the timeframe of 2001/2002 to 2005/2006. A national program provided money (£1.6 billion/US$3.2 billion) for local governments to hire private contractors to manage the condition of the network and reduce their maintenance backlog, with agreement that the governments would fund this responsibility after 5 years. So far, 20 local authorities have participated in this program.
The most recent Transport Act requires another round of LTPs covering the years 2006/2007 to 2010/2011. In the guidance to local governments for preparing this second round of plans, the Department for Transport used the following language. Because this guidance so clearly links asset management to transportation planning, the relevant sections are presented in their entirety. [6]
“Achieving value for money through asset management
Well-maintained local transport assets—including roads, footpaths, byways, bridleways and cycle paths—are essential to the delivery of better transport outcomes. They encourage walking and cycling, and contribute to road safety outcomes. They promote the quality and comfort of bus services, improve journey ambience, minimize wear and tear to vehicles, and promote better environmental outcomes including emissions and noise. Well maintained roads, footways, footpaths, streetlights and street furniture make a vitally important contribution to the quality and liveability of public spaces, and the quality of rural landscapes. LTPs should therefore clearly demonstrate how effective maintenance will contribute to the achievement of other targets and objectives. Local transport authorities may also wish to adopt effective and efficient maintenance as an important LTP objective in its own right—in particular through the development of Transport Asset Management Plans and Rights of Way Improvement Plans.
Local Transport and Highway Authorities should follow two key principles of value-for-money asset management when preparing and delivering their LTP:Transport Asset Management Plans
- Firstly, to achieve the best possible value for money, maintenance work must be carried out in good time. It is essential that authorities do not allow the total costs of maintenance to escalate by allowing assets to deteriorate to the extent the routine maintenance is no longer possible. Similarly, authorities should aim to ensure that maintenance works are not carried out more frequently than necessary.
- Secondly, authorities should consider carefully the future maintenance requirements of proposed new infrastructure before including it in their LTP. It may be that the whole lifetime cost of a capital scheme will be such that the transport need that it is designed to address could be more efficiently met through less capital-intensive or even revenue-funded interventions.
Local authorities have for many years been required to demonstrate that they are making the best use of their property and other assets, in the form of Asset Management Plans. These are made available to both Central Government and to their regional Government Office as required. The Department is now encouraging local authorities to extend this to transport assets, by drawing up Transport Asset Management Plans (TAMPs), informed by LTPs and other services and corporate plans. The County Surveyors Society,[7] together with the Local Authority Technical Advisors Group, has produced a framework for highways asset management. The Department recommends local transport authorities develop asset management plans consistent with that advice. Public Transport Enterprises and other transport authorities should consider the management of assets related to the transport system that they own (such as depots and bus facilities), even if they are not part of the public highway network.
The compilation of a TAMP will provide an authority with a tool to:
Effective TAMPs will provide the means for authorities to understand the value and liability of their existing asset base and make the right strategic decisions to ensure this base is exploited to its full potential and its value safeguarded for future generations. Where appropriate the TAMP strategy should be coordinated with those of neighboring authorities—for example, where there may be benefits from the co-ordination of maintenance work on a particular corridor. In some cases it may be appropriate for TAMPs to make reference to infrastructure owned or operated by bodies other than the authority itself, where the transport benefits of such infrastructure depend on the good upkeep of related authority-owned assets.
- Support the corporate provision of detailed information on the assets held by the whole authority—enabling better definition of longer-term corporate need and continual challenge to asset holding/use;
- Establish and communicate a clear relationship between the program set out by the TAMP and the authority's LTP targets and objectives, and ensure existing assets are in a condition compatible with the delivery of the LTP;
- Obtain and organize information to support the forthcoming (2006) requirement for Whole Government Accounting (WGA);
- Enable the value for money of local road maintenance to be considered more effectively against other local transport spending, and eventually assist local transport strategy and plan production.
Evidence about the quality of asset management within local transport authorities will form a component of the Department's assessment of provisional LTP quality. Although TAMPs are not required to be submitted with the provisional LTP, it should provide evidence that the development of a TAMP has informed the development of the LTP. Provisional LTPs should include a short summary of such evidence—the LTP TAMP report (a page or so from each contributing local authority should be sufficient in most cases).
This should set out the state of each local authority's progress in developing an effective TAMP, what has already been achieved, and any remaining challenges. As well as detailing progress towards a whole-life maintenance plan for existing assets, the LTP TAMP report should cover briefly such issues as the ambition and realism of LTP asset management targets, the whole-life maintenance resource implications of the major and other integrated transport schemes proposed in their local transport plans, and the implications of any LTP proposals to delay or bring forward maintenance work. The TAMP report should aim to demonstrate that authorities are exploiting their existing asset bases to their fullest potential and managing future maintenance liabilities efficiently. The Department will consider the evidence in LTP TAMP reports before deciding whether to require further evidence in final March 2006 LTPs.”
Another law, the Traffic Management Act of 2004, gave local authorities responsibilities for traffic management on local roads.[8] All local authorities are required to appoint a traffic manager and this appointment gives the local authority the ability to take over traffic enforcement from the local police. This act has provided the Highways Agency with improved liaison with local governments on transport matters.
Legislation and government policies relating to procurement have also influenced asset management procedures. Several major studies during the 1990s highlighted problems with traditional methods of procuring and managing major projects, especially the awarding of contracts solely on the basis of lowest price. The 1999 Gershon Report entitled Efficiency in Civil Government Procurement emphasized the benefits of privatized service delivery. The 2001 report of the National Audit Office entitled Modernizing Construction made recommendations on how to achieve sustainable improvements in construction performance, resulting in better value for the taxpayers' money. Recommendations were also made to government departments to develop more sophisticated performance measures and to measure improvements in construction performance.
“Moving into asset management is all about changing organizational culture.”
--Local government official, England
Perhaps even more important in encouraging greater attention to asset management were Treasury guidelines on resource allocation and budgeting (RAB).[9] RAB is a system of planning, controlling, and reporting on public spending. Issued in 1993, the guidelines were followed by a 1995 government white paper that committed to the use of resource accounting as the basis of public expenditure planning and control. Asset remaining useful life must be used to arrive at a current asset value, usually determined through straight-line depreciation. All local authorities have until 2006 to report their asset accounts in this format; the Highways Agency has already done so for 5 years.
In addition to the RAB requirements, the Treasury has adopted financial reporting requirements for local authorities wanting to debt finance infrastructure improvements, something that until recently has not been allowed. Known as the Chartered Institute of Public Finance and Accountancy (CIPFA) Prudential Code, this document states that local authorities wishing to borrow funds must “prove prudent stewardship of their assets,” and specifies that a fully developed asset management plan will satisfy this requirement.
The Highways Agency has defined successful asset management as consisting of several steps:
At the top management level, the Highway Agency's Business Plan identifies the performance measures that reflect the different products and services to be delivered. Other more technical guidance on asset management is available for specific asset categories. For example, asset management for roads and structures is guided by documents entitled Continuous Value Management Guide: Roads and Continuous Value Management Guide: Structures.
As noted earlier, the Highways Agency relies on the MA and MAC to achieve a single-point responsibility for asset management and maintenance in the operating areas. Begun in 2001, this program requires the MA/MAC to use quality management systems and to self-certify compliance, thus reducing the level of supervision. The MAC can design and undertake all projects up to a value of £500,000 (US$1 million). Performance specifications for routine and winter maintenance are included, along with annual targets to measure and benchmark performance and to achieve continuous improvement.
Figure 1 indicates how asset management occurs in the Highways Agency. The references inside the “databases” box are the different management information systems discussed below. Four key documents guide the decisionmaking process in the Highways Agency—the Corporate Strategic Plan, Business Plan, Balanced Scorecards, and Annual Report.[10] Each has asset management elements incorporated into it, although in some cases not in very prominent ways. For example, one aim of the latest Business Plan (2005/2006) is maintaining of the road network at minimum whole life cost, with pavement condition being a key performance indicator. In addition to these corporate documents, the Highways Agency has a developed strategic plan for maintenance.
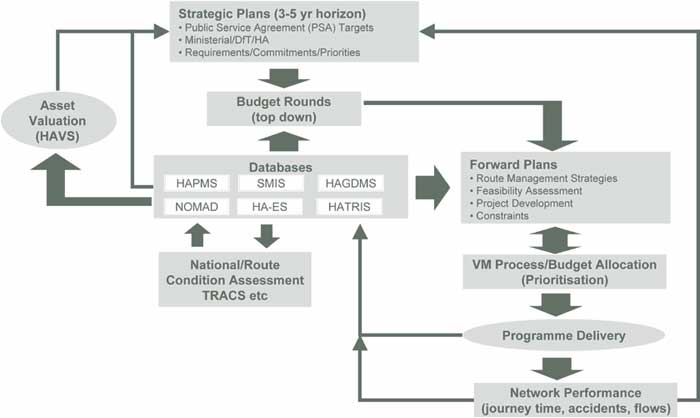
Figure 1.Asset management practice in England's Highway Agency.
Pavement asset data are the most used in supporting agency decisionmaking. Uses of this data include calculating a road condition index, availability key performance indicator, and safety key performance indicator; developing the investment program; supporting a quieter surface program; defining budget allocations; and linking to the agency's Web site for public information. Table 1 shows how the pavement asset data are used to support information requirements.
National law requires the adoption of performance indicators for all publicly supported services and functions. Given the emphasis on best value, the scan team was not surprised to find that the most important indicators were called Best-Value Performance Indicators (BVPIs). These high-level indicators, few in number, provide annual snapshots of performance for government-supported activities. For the transportation sector, the Department for Transport has made the following BVPIs mandatory for annual reporting by local authorities.[11]
Authorities are expected to develop additional indicators that they can use to guide specific aspects of their service delivery. In the Highway Agency's Business Plan, two measures relating to asset condition were reported as follows:
| Measure | Target | Outcome Achieved |
Estimated proportion of the network likely to require maintenance in the next year |
7% and 8% |
7.9% |
For safety, road surface condition index |
100 ± 1 2005-2006 |
99.4% |
For the safety measure, the road surface condition index is based on surveys covering rutting, paved surface unevenness, cracking, and skid resistance.
The Highways Agency is also developing performance indicators for structures, some of which are still in the early stages of development. These indicators include the following:
There was a sense among Highways Agency officials that the agency might be moving toward a composite, or what they termed an “amalgam,” asset management performance measure within the next several years.
The team noted some tension in the Highways Agency between goals to reduce congestion and maintain infrastructure. Given the political interest in showing progress toward congestion reduction, the natural tendency is to structure planning and performance dissemination around this goal. However, the need to maintain infrastructure not only requires substantial funding, but also contributes to traffic congestion when projects are underway. It will be interesting to see how this tension between the two agency goals will play out in coming years, because it is a tension that many U.S. transportation agencies also face.
“The best argument for asset management is that it provides service to the community in the most efficient way.”
—Department for Transport official
The performance measures local authorities use as part of their transport plan updates (which include asset management strategies) must be quantifiable and measurable targets. An example of this is found in highway lighting management. A group called the Roads Liaison Group developed a Code of Practice for Highway Lighting Management(November 2004), which recommended that local authorities use national performance indicators in their asset management efforts, but develop others more relevant to their own situation. As noted in this report, two main categories of performance indicators should be considered:[12]
Historically, management information systems in the Highways Agency have been developed independently for all assets. The Highways Agency Pavement Management System (HAPMS) has been under development since 1998, and has cost about US$3.5 million per year (not including data collection) to develop. As figure 2 shows, HAPMS receives data from a variety of sources and provides outputs to a public Web site, a program investment development tool, and budget analysis. SWEEP in this figure stands for Software for Whole-of-life Economic Evaluation for Pavements, a tool that can be used to establish priorities for pavement investment strategies. Members of the Highways Agency and its transportation partners can access HAPMS.
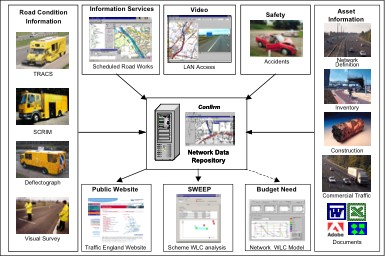
Figure 2.Highways Agency Pavement Management System (HAPMS).
Although not developed solely by the department for transportation purposes, a United Kingdom Pavement Management System (UKPMS) has been evolving over the past 15 to 18 years for use on local roads. In U.S. terms, UKPMS is an architecture for pavement management systems that suggests functionalities and characteristics, but does not mandate specific vendors or software systems. UKPMS has standard techniques for condition assessment and inventory, and provides facilities for recording inventory, assessing the condition of paved assets, and costing and prioritizing potential projects works on condition and economic factors. The Department for Transport has been strongly encouraging local authorities to adopt UKPMS as the framework for their pavement management systems. To date, vendors of five pavement management systems have been accredited as meeting UKPMS conditions. The Highways Agency's pavement management system has not been assessed against the system architecture requirements.
The Highways Agency also has a Structures Management Information System (SMIS), a repository of condition data for all structures on the national network. Not surprisingly, given the age of England's bridges and the history associated with innovations in bridge design emanating from England, many bridges are considered “heritage” bridges, requiring special handling. For example, 60 percent of the bridges in Northumberland, located in northern England, are heritage bridges.
Other asset management systems that provide information to the decisionmaking process include HAGDMS, a geotechnical/slopes database; HATRIS, a traffic information system; HA-ES, an environmental management system; and NOMAD, a technology equipment database.
Figure 3 shows Highways Agency's current thinking on a desired direction for an agency-wide infrastructure asset management system. As the figure shows, this desired structure includes closer integration of the different databases and a strong linkage to strategic management. The databases used as the traditional support systems for engineering decisionmaking remain as the foundation for future activities (the lower level in the triangle). However, the agency envisions new management systems to aggregate this data and to produce information for use in performance reporting and monitoring and ultimately in strategic management activities. In addition, several Highways Agency officials noted that a major focus of agency attention is on traveler information, which in figure 3 is a major recipient of the data stored in the databases.
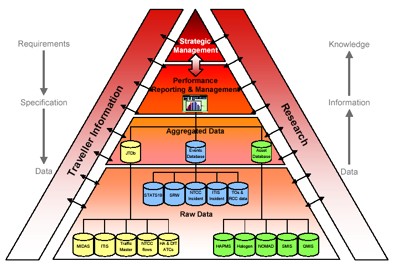
Figure 3.Desired structure of a future asset management system for the Highways Agency.
The previously mentioned Code of Practice for Highway Lighting Management recommends that local authorities develop and operate detailed asset management systems of their public lighting stock to do the following:
Fault and repair histories, together with the results of inspections and electrical and structural testing, were recommended to determine future asset replacement programs. The types of management information that would come from such a system include analysis of trends, identification of recurring faults and specific component failure, monitoring of response times, and a spatial distribution analysis to determine if some parts of a jurisdiction are experiencing unusual amounts of maintenance trouble.
Highways Agency staff members played an instrumental part in developing a data management guide for an organization called the Western European Road Directors (WERD). Much of what is in this guide reflects the philosophy of the Highways Agency on a data-collection strategy for asset management. For example, the seven steps to successful data management were described as 1) determine business information needs, 2) review current situation, 3) analyze data, 4) design a data management regime, 5) develop an implementation plan, 6) establish a data management organizational structure, and 7) continually review and improve the strategy.
“We had bags of data, but not much information.”
— Maintenance concessionaire
Much of the data collected as part of HAPMS relates to pavement condition, which has evolved over the past 30 years, as the following time line shows:
1977 Manual visual surface assessment (using 100 meter segments)
1984 Slow-speed machine structural assessment
1988 Medium-speed skidding assessment
1990 High-speed surface assessment
1998 First generation stand-alone integrated database
2001 Second generation desktop delivery
The types of data collection that occur in many local authorities include the following (taken from the instructions for the UKPMS):
The above data-collection tools are primarily for road condition. The Highways Agency has received some criticism for not having data on several other asset types, such as light columns and drainage. Accordingly, the 2007/2008 target year for the agency's Business Plan has a goal of completing an inventory and condition record of all asset categories under the agency's responsibility.
Similar to data collection, the analysis and prioritization approaches used in the Highways Agency have evolved over the past 30 years. For establishing priorities, this evolution has included the following:
1977–2000 Stand-alone condition-based trigger criteria
2000–2004 Whole-life cost spreadsheet
2005 + Integrated whole-life costing module in HAPMS
Project prioritization also includes identifying and managing risks associated with the road network. The prioritization process involves using a risk matrix in which projects or project types are assigned a score. Figure 4 illustrates the use of risk in assigning priorities to projects pertaining to bridges and other structures.[13] As shown, each box in the figure relates to a probability of failure occurring for a specific reason, with higher likelihood of failure resulting in greater attention in the investment program. Probabilities are found in look-up tables in a Highways Agency manual. For example, the likelihood of a risk event can be calculated as the following:
L(Risk Event) = L (Cause) x L(Defect) x L(Exposure) x L (Effect)
where L stands for likelihood. Assume that the following table serves as the source of likelihood values (in reality, there would be separate tables for different components of the process in figure 4).
For a particular project, it has been determined that the likelihood of cause is high (0.85), the likelihood of defect is medium (0.50), the likelihood of exposure is low (0.15), and the likelihood of effect is high (0.85). The risk associated with this project is thus estimated as the following:
L(Risk Event) = 0.85 x 0.50 x 0.15 x 0.85 = 0.054
By conducting a similar assessment for all structures projects, one can identify the projects that pose the highest risk of failure and allocate funds to solve the most serious problems.

Figure 4.Similar to other countries, England has significant challenges maintaining the condition of historic bridges.
Table 3 is a scoring matrix used by managing agents and Highways Agency personnel to assign priorities to road maintenance projects. Value management workshops, which include participation from project sponsors, contract agents, specialists on pavement treatments, and Highways Agency program development staff, are used to review the scores the managing agent has assigned to each project. Projects are classified as “committed,” “unavoidable,” or “desirable.” Each project must be analyzed with the software program SWEEP (the Incremental Economic Indicator (IEI) and user costs shown in table 3 are calculated with this software package). Base conditions are analyzed as well as future whole-of-life treatments over a 60-year analysis period. SWEEP will calculate the project cost (including traffic management costs) of each treatment option, as well as the associated user costs. The result of this analysis is a 4-year program of investment.
“We used the term ‘optimize’ to mean obtaining the most economically efficient answer . . . however, given the broad reach of asset management, ‘optimize’ now means supporting decisions with facts.”
— Local official
For asset valuation, the whole-of-government accounting approach requires valuation of the asset base (inventories needed), and depreciation (condition of asset needed). In renewals accounting, on the other hand, deterioration is based on condition change and differences from required levels of service. In England, valuations are required of all assets by 2006/07 and renewals accounting by 2007/08. The Highways Agency’s road network is professionally valued every 5 years, using equivalent replacement cost. Depreciation is calculated, taking into account the condition of the network. Estimates based on inflation and construction cost indices are used to calculate values for in-between years. Renewals accounting is used for assets that meet the renewals criteria.
The Highways Agency has also adopted a policy to examine maintenance requirements during the project design phase to see if the design can be changed to lower the life cycle costs of the project. As an example of this, the Highways Agency has published a design standard for fiber-reinforced polymer (FRP) bridge decks that offer lower life cycle cost designs.
The extensive passenger transportation system in England afforded the opportunity to examine the asset management practices of other transportation modes. One of these modes was Network Rail, the owner of the rail infrastructure in England. (Rail operators pay Network Rail to use the rail network.) Network Rail is responsible for an extensive asset inventory, not the least of which is 40,000 rail bridges. The asset management process is guided by engineering policies that indicate required condition levels and acceptable performance ranges. About 300 inspectors examine the network each year, with one-sixth of the network subject to a detailed inspection and the remaining five-sixths undergoing visual inspection.
Network Rail has developed a costing model called Structures Annual Cost Profile (SACP) for use in policy development and regulatory review. In addition, a Structures Condition Marking Index (SCMI) is used for bridges, tunnels, retaining walls, culverts, and earthworks to assign priorities. Data are incorporated into a STructures Asset Management Program (STAMP), which is based on whole-life costing procedures. The STAMP rates assets on a score of 1 to 100, where each asset element is weighted from 1 to 10 and defect severity and extent also are rated from 1 to 10. Figure 5 shows the type of information that can be produced from the asset management program.
Network Rail also uses STAMP to assess the policy implications of different scenarios. For example, three scenarios used in a recent study include the following:
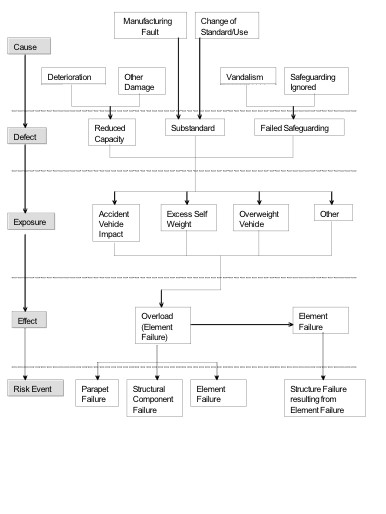
Figure 5.Calculation of risk of failure for structures in England.
Table 3.Value management scoring framework for maintenance projects in England.
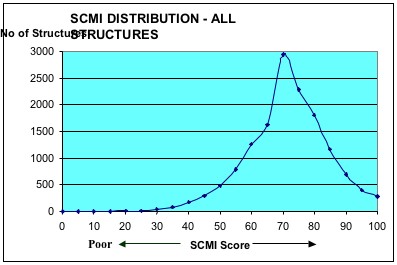
Figure 6.Bridge condition distribution, Network Rail, England.
The Highways Agency is similar to many transportation agencies in the United States, facing important challenges not only with asset condition, but also significant political pressures to alleviate congestion. This has created tension between the two goals in terms of service delivery.
Several aspects of England's approach to asset management merit special attention. As in other cases, England seems to be ahead of most U.S. agencies in applying performance measures to asset management as well as other transportation goals. Performance measures or best-value performance indicators are found at all levels of government and provide consistency in the type of information produced at the national, regional, and local levels. This observation is not surprising, given that national legislation and government policy have encouraged this consistency for many years. An example of this consistency is found in the government policy of reducing the maintenance backlog by 2010; such a performance measure was found in plans at all levels of government.
Much of the road network service delivery in England is done with private contractors. The performance orientation and reporting of best-value performance indicators are found in these contracts as well. In addition, national policy has strongly encouraged the use of privately financed services to reduce the maintenance backlog, with the national government providing funding to pay for the first 5 years of such an approach to maintenance with an agreement for local government support thereafter.
England also appears much more concerned about some types of transport assets that receive less attention in the United States. For example, a great deal of attention has been paid over the past several years to the condition of streetlights. A deterioration model is being developed that will allow transportation agencies to prioritize investments for this asset. Similarly, more attention appears to be given to appurtenances and footpaths/sidewalks than is typical in the United States.
The Highways Agency is investing in new technologies for more efficiently collecting condition data critical to asset management decisions. An example of this is the high-speed deflectograph vehicle recently purchased from Denmark.
Asset valuation is based on depreciated values, which are calculated with a straight-line depreciation method. Starting in 2007/2008, the Treasury will require a renewals approach to asset value, which depends on asset management as a means of determining asset remaining useful life.
Local government and professional association involvement in supporting asset management is quite impressive. Similar to New Zealand (see next case), an association of asset management professionals and local officials has become very important in providing technical information on asset management. The documents it has produced are basic references on the subject, and the most influential document, A Framework for Highway Asset ManagementM, has laid out the fundamental structure for asset management that all levels of government appear to follow. Another group, the Roads Liaison Group, has produced codes of practice that guide local asset management formulation and decisionmaking.
Finally, the concept of an asset manager as a professional job appears to be evolving in England. Several regional and local groups market jobs this way, or have attached asset management as a responsibility to the more traditional civil engineering job description. It will be interesting to follow this development for its impact on human resource development strategies and university transportation programs.
[2] Most of the agency representatives participating in this visit represented England, not the United Kingdom. Thus, Northern Ireland, Scotland, and Wales were not part of the discussions.
[3] http://www.highways.gov.uk/aboutus/intro.htm, accessed 8/3/05
[4] Highways Agency, Strategic Planning Guidance: 2006-07 and Beyond, London: England, March 2005.
[5] Institution for Highways and Transportation, Delivering Best Value in Highway Maintenance, Code of Practice for Maintenance Management, Basildon Essex, England, July 2001.
[6] Department for Transport, Full Guidance on Local Transport Plans, 2nd ed., London, England, Dec. 2004, accessed at http://www.dft.gov.uk/stellent/groups/dft_localtrans/documents/page/dft_localtrans_504005.hcsp
[7] The County Surveyors Society is described in Chapter 5.
[8] See, http://www.dft.gov.uk/stellent/groups/dft_roads/documents/page/dft_roads_026488-01.hcsp#P15_304
[9] Department of Treasury, Managing Resources, Full Implementation of Resource Allocation and Budgeting, London, England, July 2001, accessed at :
http://www.hm-treasury.gov.uk/mediastore/otherfiles/rab30_03.pdf
[10] See, Highways Agency, http://www.highways.gov.uk/aboutus/corp_docs.htm
[11] Highways Agency, Business Plan 2005/2006, see: http://www.highways.gov.uk/aboutus/corpdocs/bus_plan/2005_2006/.
[12] Roads Liaison Group and UK Lighting Board, Well-lit Highways Code of Practice for Highway Lighting Management, November 2004, found at:
http://www.dft.gov.uk/stellent/groups/dft_roads/documents/page/dft_roads_037869.pdf.
[13] Highways Agency, Value Management of the Structures Renewal Program, London, England, Oct. 2004.
[14] Highways Agency, Value Management of the Regional Roads Programme, London: England, March 2005

