U.S. Department of Transportation
Federal Highway Administration
1200 New Jersey Avenue, SE
Washington, DC 20590
202-366-4000

4. NETWORK CONDITION & ACHIEVEMENT OF CONTRACT KEY PERFORMANCE INDICATORS
5. ASSET MANAGEMENT PRACTICES AND STRATEGIES
6. CURRENT CONTRACTUAL COMMITMENTS
9. MODELLING & THE 10-YEAR FORWARD WORKS PROGRAMME
The PSMC 001 network is managed and maintained under a performance specified maintenance contract (PSMC). This provides for the maintenance of the network within the limits set by the PSMC performance regime and for this to be achieved for tendered Lump Sum payments.
In 1998 Transfield Services and its supplier partners made a detailed study of the State Highways that comprise the PSMC 001 network. Following this a 10-year network management plan was developed and costed. This was prepared in a competitive commercial environment with little capacity for conservatism or contingency. This formed the basis of the successful tender for the management and maintenance of this network.
It is noted that six years have elapsed since the preparation of that plan. Over this time there have been significant changes in the roading industry, and the expectations of key stakeholders; however, it is noted that Transfield Services continues to deliver better than the contract requirements in the key performance measures. In the reporting of network performance we show how the network compares with national average values as well as the contracted requirements for this contract. It should be noted that the national values are derived from networks with varying management regimes, contract performance requirements, and levels of financial control.
Further there have been other benefits achieved over the contract to date, including an appreciable strengthening of the network pavements and a reduction in the social cost of crashes occurring in the network. These achievements are being delivered within maintenance and management budgets that were prepared in 1998.
This document has been prepared to comply with the requirements of Transfund and Transit New Zealand. It sets out our intentions and recommendations for the financial years 2005/06 and 2006/07. It has been prepared as a part of The Transit New Zealand trial of Two-Year Network Maintenance Plans. In it we have taken into account our contractual commitments for cost and levels of service provision. We then combined this with the philosophy outlined in Transfund's National Land Transport Program of providing the most cost-effective strategy in the medium to long term together with Transit's vision of a transport system that builds a better New Zealand and with the aims of Land Transport Management Act 2003.
This annual plan also utilises the lessons learnt in the five and a half years the PSMC has been operating. We believe that it is in the later stages of the PSMC that the effects of ownership will come to the fore and demonstrate the effectiveness of the PSMC procurement model. Key initiatives in this include:
This annual plan also contains requests for improvements to the network above the requirements of the Lump Sum scope in the form of:
The map below shows the full PSMC001 network.
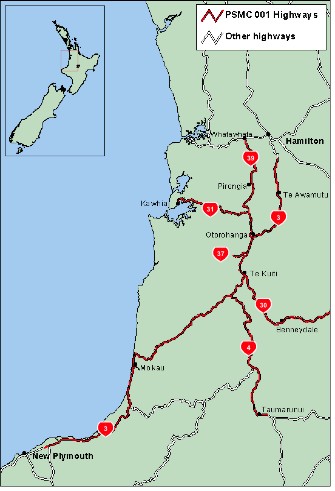
The PSMC001 network incorporates 3 Regional Councils (Waikato, Taranaki and Manawatu-Wanganui) and 6 District Councils (Waipa, Waitomo, Otorohanga, Ruapehu, Waikato, New Plymouth)
Traffic volumes vary from 250–5,000 vehicles per lane per day across the network. We have a higher-than-expected HCV growth on certain sections, notably SH 30, 31, 39, and 3 South. Section 7 of the Network Statement provides further detail on the traffic profile for these areas.
For the purposes of Temporary Traffic Management at worksites, the bulk of the network is designated CoPTTM Level 1 with the portion of SH 3 from Hamilton Airport turnoff to Te Awamutu being CoPTTM Level 2 (approximately 19 km).
The highways on the network consist typically of granular pavements, some with a degree of modification, with thin bituminous surfacings. Pavement materials are moderate crushing strength greywackes, with minor amounts of plasticity, varying in depth from 100 mm to 800 mm. There is a supply issue within the region for quality basecourse material. This is compounded by the fact that many of the subsoils throughout the network do not lend themselves to supporting cement stabilised pavements.
The climate can be described as wet temperate with annual rainfall averages ranging from 1,200 mm to over 2,600 mm across the region.
Each highway of the network has different characteristics and is described separately as follows:
State Highway 3
SH 3 is part of a strategic link along the west coast of the central north island and its operation is seen as critical to the health of the Taranaki economy. A special interest group, the SH3 Working Party, has as its principal objective the promotion of roading improvements to SH3 between New Plymouth and Te Kuiti and the protection and enhancement the northern Taranaki corridor as a strategically important route. The group is comprised of representatives of district and regional councils, Transit New Zealand, Transfield and road users, and is convened by Taranaki Regional Council.
SH3 passes through terrain ranging from rolling pastoral in the Waikato to the steep terrain in and around the Awakino Gorge and Mount Messenger. The restrictions created by the latter two geological features, including two tunnels, have a significant effect on alignment, safety, and travel time. The topography and underlying subsoils, particularly the Mahoenui Mudstone, in the King Country are unstable and susceptible to heavy rain and periods of prolonged wet weather, both common conditions experienced within the region.
State Highway 39
SH 39 travels through rolling Waikato farmland and up until January 2001 was part of the Local Territorial Authority roading network. The highway was designated as a State highway at that time in recognition of the role that it plays in providing a western bypass to the Hamilton Urban area.
State Highway 4
SH 4 travels through the rugged King Country and Taumarunui hill country. When the topography around SH 4 is not steep hill country the road is generally sitting on a flood plain. To the north, the road is near the Mapiu and Mapara Streams, which are bedded in large mudstone alluvial flood plains and to the south the highway sits on the Ongarue River flood plain, which is comprised of soft pumiceous and silty alluvials that erode very readily.
State Highway 30
SH 30 near to Te Kuiti is dominated by the karst environment, with subsidence in the pavement common. Further east, the road is built on volcanic terrain and is often affected by the sensitive clays formed from ash deposits.
State Highway 31
SH 31 travels through rugged hill country from the intersection with SH 39. The topography is very steep and the underlying geology of Te Kuiti Group has formed steep bluffs very close to the road's edge in many sections of the highway. Volcanic deposits from Mount Pirongia cap the Te Kuiti Group and are readily erodible when saturated.
State Highway 37
While SH 37 is surrounded by the karst topography of Waitomo, the highway travels through easy undulating country and provides an important tourism link to the Waitomo Caves. It is in reasonable condition for its current traffic loading.
The network also forms part of an alternative route to SH 1 through the centre of the north island via SH 39, 31, 3, and 4. Both SH 30 and SH 31 have experienced significant heavy traffic growth due to production forests coming on stream for harvest and have had large capital investment in upgrading pavements to cope with this. While treatment to date has been successful, ongoing investment levels need to be maintained. Section 7 of the Network Statement and Appendix 1: Pavement Maintenance elaborates further on this issue.
As detailed above, the network is a challenging one with a range of difficult conditions and issues that have been managed and/or mitigated as part of the PSMC001 Network management strategy and compilation of this 2-year Annual Plan (and associated 10-year forward Works Program)
Preventive Maintenance
The Waikato/Bay of Plenty Transfund Representative has endorsed the sites put forward in Appendix 14 of this Bi-Annual Plan. Cost-effective solutions have been promoted to ensure that least-whole-of-life cost options, network security, and safety are maintained. It is likely that the highway infrastructure will be exposed to long-term damage if the proposed strategy is not implemented.
Heavy Commercial Traffic Growth
HCVs on SH 30 (mostly logging related) are still contributing to rapid deterioration of pavements. Also, SH 39 is showing signs of distress due to increased HCV loading related to its designation as a state highway and this is expected to increase significantly with forestry blocks coming on stream in the near future. The Contract Lump Sum caters for HCV traffic growth up to 5 percent annually. This risk profile boundary has been exceeded on SH 30, SH31 (East/West Sub-Network), and SH39 (SH39 Sub-Network). Section 7 of the Network Statement and Appendix 1: Pavement Maintenance elaborates further on this issue.
CoPTTM Compliance
In 2001 Transit introduced its new Code of Practice for Temporary Traffic Management. At that time an assessment was jointly made of a practical level of implementation. This included working with less than the specified levels of control and not following the Transit classification of the section of SH 3 north of Te Awamutu as Level 2. Since that time the roading industry has moved to a higher level of compliance. As such the interim standards agreed in 2001 are no longer applicable. Further, the section of Level 2 road has not been reclassified (less than minimum length recommended). As a result, we must alter the funding application to suit full requirements of CoPTTM. The details of the merits of this claim and the calculation of its actual value shall be through the regular contractual mechanisms. It has been included in this Plan in order that Transit may take this into account in its future funding planning.
Skid Resistance
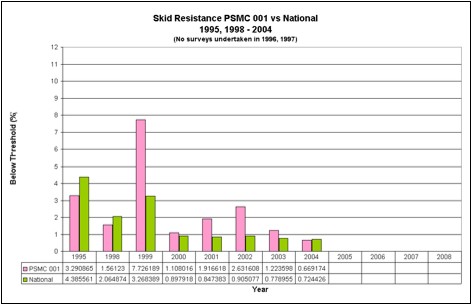
The plot below shows that the skid resistance below threshold measure is better than the national average for the first time in seven years.
Historically maintaining good skid resistance across the PSMC001 network has been difficult due to the fact that the best locally sourced sealing chip has only achieved a PSV of around 52-53. The locally crushed material was predominantly elongated as a result of the type of crusher typically used in the region. This chip had been used for all sealing prior to 2002.
Since that time, there has been a determined strategy by the PSMC001 team to improve the performance of our seals in terms of skid resistance. This strategy has included:
Based on the trend for improvement evident in the graph above, this strategy appears to have been successful in delivering a safer network for the road user. This strategy will be continued with the 2005/06 and 2006/07 programs, in order to extract further benefits.
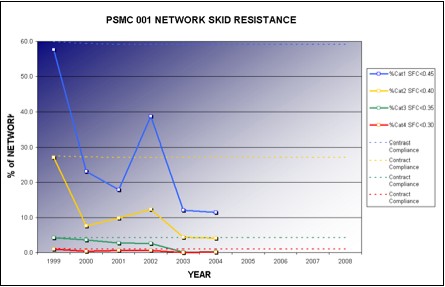
The above graph is used to track and monitor PSMC001 performance against the Network Management contract Skid Resistance Key Performance Indicator (KPI). The data reported on above is sourced from the SCTIM survey conducted by WDM. It is noted that these are less restrictive than the National values and that the network is performing better than the contracted requirements.
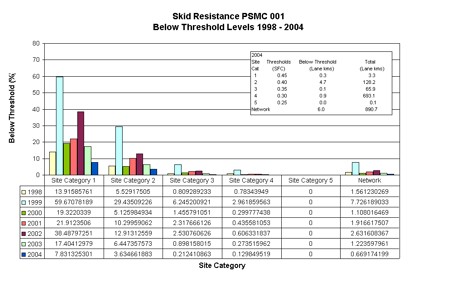
The same trend is evident on the National Condition graph as shown below.
The plot below shows that the percentage of the network texture depth <0.5 mm measure is worse than the national average by 0.05 percent; however, this has been showing a trend for improvement over the last few years. The sealing strategy described above has also been utilised towards the reduction of the network area that is low on texture.
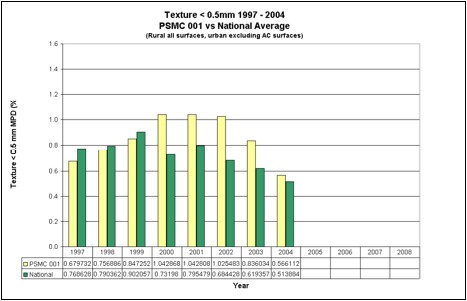
Because there is a high proportion of our 2003/04 sealing program that was completed after the network surveys, we expect this trend for improvement to continue next year.
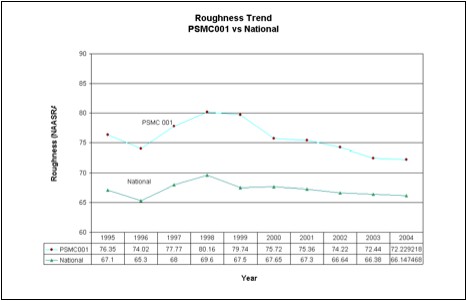
This rate of improvement is a significant achievement, yet it has been possible only as a consequence of the poor state of the network at the commencement of the PSMC001 contract. The network condition has stabilised to an extent and it is not likely that we will provide further improvements in average roughness. That being said, we expect to see incremental annual improvements in roughness as a result of PSMC001 contract commitment to rehabilitate 50 percent of the network area through the life of the contract. Our current modeling output and forward works program predict a handover average network roughness of 72 NAASRA counts.
The graph below is used to track and monitor PSMC001 performance against the Network Management contract Mean Roughness Key Performance Indicator (KPI). As is indicated, all KPIs in this category have been met to date, with the forward works program for 2005/06, 2006/07, and future years set at continuing to meet this requirement.
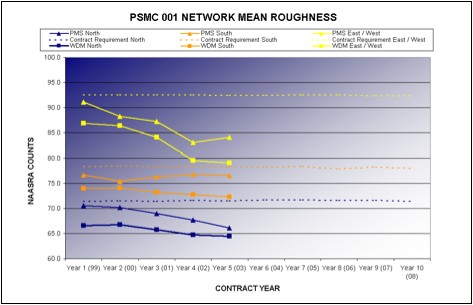
While we do not expect that our network average roughness will close in on the national average, we will continue to monitor and treat areas of high roughness (big bumps) as part of our pavement management strategy. We have reduced these areas by 65 percent since the start of the contract and we aim to continue the trend of improvement shown by the graph below.
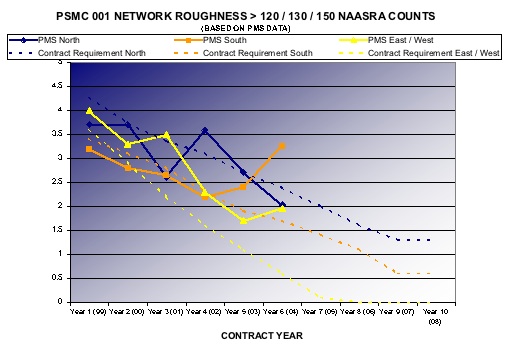
This type of roughness creates short bursts of highly uncomfortable travel for road users, which lead to a very poor perception of overall network condition. Through the timely treatment of such problems, we aim to minimise the occurrence of discomfort and condition perceptions.
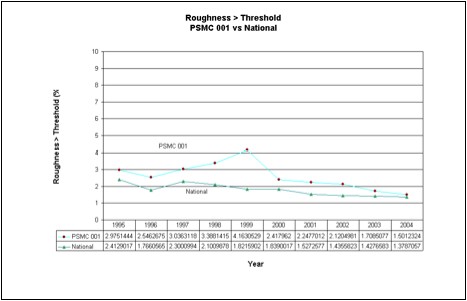
The graph above is based on data sampled by PMS during early 2004, and suggests that there is an increasing trend in the incidence of rough bursts on the network. This is contrary to the WDM information as supplied by Transit, though this may be related to the difference in timing of the surveys. We will monitor this effect over the course of the next 12 months and ensure that this trend, whether real or perceived, is not allowed to continue.
Rutting
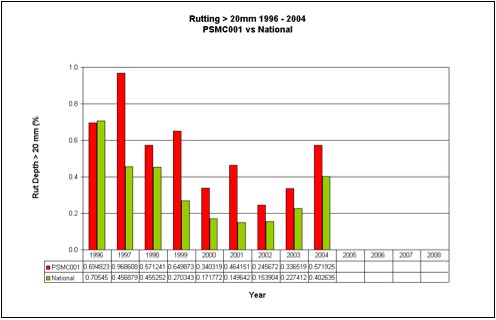
Based on the Transit National Survey graph below, the PSMC001 network is shown as drifting out on the length of rutting greater than 20 mm deep. While it is noted that this trend is in some way contributed to by a change in the setup of the measurement vehicle (as noted in the State Highway Network Condition Report 2004), it is consistent with our understanding of network behaviour. Consideration should also be given to the scales involved. The network appears to be 0.2 percent worse than the national average. This equates to 900 m of carriageway.
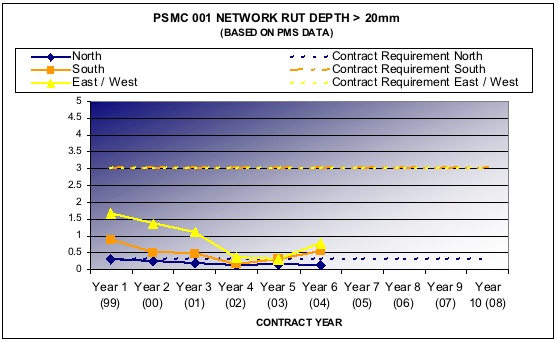
The second plot below is used to track and monitor PSMC001 performance against the Network Management contract Rut Depth >20 mm Key Performance Indicator (KPI). As is indicated, all KPIs in this category have been met to date, with the forward works program for 2005/06, 2006/07, and future years set at continuing to meet this requirement.
Notwithstanding the fact the network is in better condition than is required by the contract, we would like to address the recent deterioration. We have completed a recent study on the difference in rut depth values between the inner and outer wheel path. This study found a high degree of correlation of sites with a high rut differential to those sites with poorly functioning drainage. These sites contained a high proportion of the ruts over 20 mm in depth. For the 2004/05, 2005/06, and 2006/07 seasons, we have programmed a large-scale drainage reinstatement package (Lump Sum activity) and continue with our rehabilitation work to correct the increase in rutting.
Granular Overlay Deficit
One of the key issues of a long term Performance Specified type contract is ensuring that the contractor continues to invest in the network and does not just consume the investments that have been made previously. Transit covered this particular risk by including a performance measure of the structural integrity of the pavements, called Granular Overlay Deficit.
The granular deficit measure was developed to indicate the structural health of the network. The measure, using deflection and curvature information from a falling weight deflectometer (FWD) with traffic data, then calculates the nominal volume of granular overlay required to produce a 25-year design life using the Austroads Pavement Design Guide procedures.
After almost 6 years of the PSMC001 operation, the effects of the implementation of the PSMC001 Forward Works programme are measurable. The pavement of the Network is substantially stronger than at the start of the contract. The granular deficit has been reduced by almost 150,000 cubic metres (m).
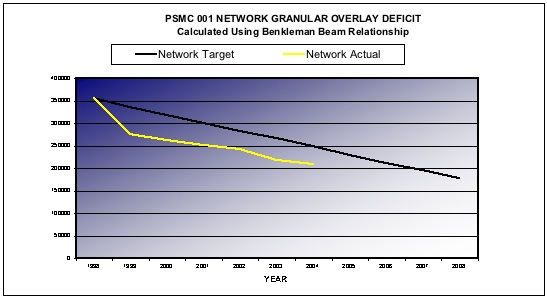
Note that the relationship used to calculate the information used on the above graph is different to that nominated in the contract. This is due to the potential for interpretation included with the contract specified method. It is highly sensitive to pavement profile information and given the paucity of this type of data, we have proposed to use this simpler method. Note that we have recalculated the baseline and network target figures using this same method. The PSMC001 Management Board is currently considering this new methodology.
Pavement Issues
There continue to be issues with pavement repairs throughout the network with the worst affected area being SH3, south of 8 Mile Junction (SH4). This problem is a complex one and is related to basecourse quality, topography, climatic conditions, subgrade standard, and increases in heavy vehicles. Internal Task Groups have been set up to investigate and enhance patching methodologies and techniques, including surface finishings.
Given the range of causal factors it is difficult to come up with a simple one-size-fits-all solution. Rather, we are working on a range of methods to target this problem, including incorporating pavement repairs into our rehabilitation strategy, training staff in both design and treatment of repairs, and looking at alternative treatment methodologies and materials. We have moved to patching potholes with hotmix in dry conditions and good quality premix in situations in wet situations. This has seen a significant improvement in the life of these repairs in wet and adverse conditions.
We are still well in front with KPIs for roughness and rutting over the entire network; however, this year has seen both these measures trend up in the South and East/West sub-networks. This is seen to be related to the issues discussed above as well as being drainage related. There will be an increased focus on drainage works over the next two years, which when combined with an improved pavement repair strategy should lead to further improvements in network KPIs for these sections. We will continue to monitor these issues closely.
In terms of pavement management strategy, we have targeted large-scale pavement strengthening. As part of our tender commitment with Transit, Transfield Services is required to complete 25-year-life reconstruction work on at least 50 percent of the network by area. This strategy has resulted in large improvements in the network granular overlay deficit since the start of the contract. Our challenge over the next few years is to refine this strategy to help address the issues noted above in reactive maintenance.
Surfacing Issues
The 2004/05 rehabilitation program includes significant areas of asphaltic surfacings, specifically on Mount Messenger and in the Te Awamutu urban area. These areas have performed relatively poorly and are only about 5 years old.
Currently, there is relatively little asphaltic surfacing on the network; however, with increasing traffic volumes and corresponding increases in surfacing stress levels, it is envisaged that more isolated intersections will require such treatment in the next few years. Due to minimum texture requirements and increasing vehicle stresses, these treatments must be with high PSV Stone Mastic Asphalt (SMA). We have already completed one such treatment in 2003/04 and currently it is performing well.
SCRIM remains an issue of the PSMC001 network due to the high proportion of Category 2 sites combined with a lack of top-quality sealing chip that may be sourced locally. Areas of particular concern are SH 3 south of 8 Mile Junction and SH 4. Our management of SCRIM sites has adopted a practical approach wherein we have made detailed site assessments in conjunction with the SCRIM data prior to making any treatment decisions. This has lead to an improvement shown in each of the last three seasons.
In terms of treatments, the rehabilitation and resealing programs address the majority of SCRIM issues. We have certain situations that cater to water blasting; however, this treatment is not seen as a permanent repair method. Flushing returns within 12-18 months on most of our problem sections, due to the large amount of residual bitumen that exists within our seals.
In terms of the management of the network, our maintenance behaviours are driven by Key Performance indicators (KPIs). There are KPIs that apply to most of the activities performed by Transfield Services against which we are assessed annually. Some of these KPIs have been presented above; however, there are a total of 214 against which our performance is measured. In this number there is a degree of redundancy that the project team has attempted to reduce and this process of refinement will continue in the ensuing years. The KPIs are broken into three sections, which are summarised below.
Asset Performance Indicators
These indicators relate to the actual condition of the asset at the time of measurement. They represent a snapshot of network condition and give an indication of the quality of the product that is being provided. We have demonstrated a high degree of conformance to the criteria in this section, as is evident from the information tabled above. There are measured results of performance that exceed the contract minimum requirements. Whilst this does equate to tangible benefits to stakeholders, an assessment may be required to ensure this investment is in the areas of best return.
Contract Performance Measures (Response Times)
These measures are a summary of the actual response times to attend to various services as measured through the year. Depending on the particular service, there is a maximum time for response permitted under the contract and we are measured against this standard. For many of these measures we demonstrate a high level of conformance, most notably in the response to emergency incidents. We have received numerous congratulations from external agencies such as the police and the Road Transport Authority for excellent services provided in incident response situations and this is an area of pride for the contract team.
Management Performance Indicators
These indicators relate to the performance of the management team in contract reporting requirements and customer enquiries. Generally the performance of Transfield Services in this area over the past year has been good; however, we are aiming to provide an improved level of service in terms of the delivery of capital projects into the future.
The PSMC001 contract commenced on 11 January 1999 and has a ten-year performance based duration. A maintenance risk profile is included in the PSMC001 contract, which defines what elements of risk are borne under the lump sum, and which are borne by Transit.
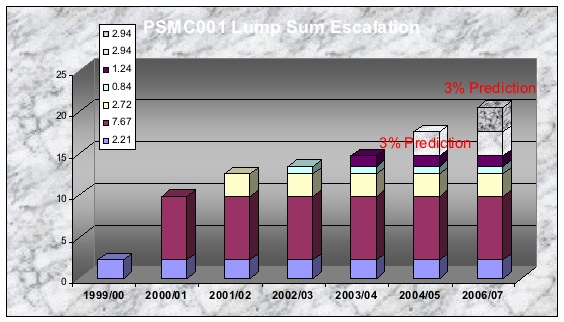
Two items of maintenance funding in excess of the contractors risk profile are forecasted in 2005/06 and 2006/07. These items are:
Escalation accrues annually and the PSMC001 lump sum amounts reported in this annual plan reflect a prediction being made that escalation of 17.6 percent will be due through the course of the 2005/06 financial year, and 20.5 percent for 2006/07.
There have been 9 closures of the SH 3 link in the past year and 5 of these were for under an hour. All were slip, accident, or flooding related. No closures were for more than 12 hours.
There are sections of the network that have experienced traffic growth rates higher than that of the maintenance contract risk profile. We are still working on data on sections of SH 3 sites where initial indications show increases outside the risk profile of 5 percent. The Traffic Growth Report attached in Appendix 7 details traffic growth statistics for SH 30, 31/0 (East/West Sub-Network), and 39 (SH39 Sub-Network)
Specific sections are summarised as follows:
East/West Sub-Network
SH 30: Continued heavy traffic volumes outside the risk profile due to logging have been recorded along this route. This Two-Year Plan caters for the upcoming update to the current 2003 SH30 Traffic Risk Profile Exception Report. The report outlines extra costs incurred for extra design/construction of pavements to cope with the increased loadings and maintenance costs incurred above a baseline benchmark that have been incurred since July of 2003.
SH39 Sub-Network
SH39 (and SH 31/0) has experienced increased heavy traffic due to State Highway designation status and resulting improvements made on the road. Transfield is experiencing increased maintenance costs for this section that are over and above baseline maintenance costs and, where relevant, increased design costs.
The network has seen a reduction in the social costs of crashes over the last 5 years, from an average of over $30 million for the three years prior to the PSMC to a $16 million average for the past four years, a nearly 50 percent reduction, significantly better than national trends.
| Year | PSMC 001 Social Cost | National Highway Network |
|---|---|---|
1996 |
$29,875,000 |
$768,853,000 |
1997 |
$35,609,000 |
$804,033,000 |
1998 |
$27,179,000 |
$657,281,000 |
1999 |
$25,566,000 |
$763,621,000 |
2000 |
$14,501,000 |
$663,033,000 |
2001 |
$19,345,000 |
$674,826,000 |
2002 |
$12,628,000 |
$599,438,000 |
2003 |
$17,316,000 |
$682,131,000 |
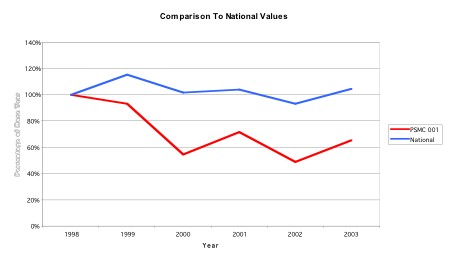
However, the management of the PSMC001 Network remains firmly focused on locking this improvement in and gaining further reductions. To this end we have carried out analysis of the network crash history over the past three years. This information shows that the significant accident causal factors on the PSMC001 network are:
Bends
Cornering and related accidents contribute to approximately 65 percent (53 percent last year) of our total accident rate. The social cost of these accidents over the last three years is valued at over $30 million. This is by far the largest factor in accidents on our network. At present, the PSMC001 contract is meeting its contract specified Skid Resistance KPM requirements and a <% Below Threshold result less than the National average. Regardless of these results, a large focus of both the maintenance and improvement programmes is on driving down the accident rate experienced on bends.
An example of programme optimisation and safety focus is shown by the PSMC001 use of the Norsemeter ROAR variable slip skid resistance tester to study each skid category 2 corner on the network and rate each one on a probability curve in terms of accident risk. We will then target these corners in a prioritised manner with treatments that will help to reduce accident risk, complimented by the implementation of minor safety programs, signage upgrades, vegetation clearing, and enhanced recovery zones (e.g., Appendix 2: - seal widening associated with AWT). This ROAR Risk analysis process is in the early sages of development with the methodology being presented to the PSMC001 Management Board in late October 2004.
Vehicle Overtaking
Passing and head-on related accidents contribute to around 15 percent (16 percent last year) of crashes on the network with a social cost of $8 million for the three-year period 2001-03. Transfield Services, in conjunction with Transit and with the support of relevant local authorities, has pushed through a program of passing lanes and passing lane extensions to try and address this issue. However, there are additional sites proposed in the capital plan that are a key part of this ongoing strategy.
Intersections
Turning-related crashes account for approximately 5 percent (10 percent last year) of all crashes. To try and further reduce the number of intersection-related incidents, lighting improvements, pavement marking, signage, sight distance, and surface condition at intersections are taken into account when developing maintenance (Lump Sum activities) and improvement programs (predominantly Minor Safety).
The project team has utilised PARMMS road manager as a modelling tool since contract commencement. Transfield has provided a commitment to deliver dTims output files to enable the PSMC network to be incorporated within the National Pavement Model.
Historically the PSMC 001 model has focused on satisfying contract KPMs and long-term pavement performance. This was achieved by assigning a high priority to the roughness condition parameter, as roughness was considered to be the best overall single indicator of the pavement condition.
However there has been a non-programmed increase in isolated reactive pavement maintenance throughout the network. The minimisation of routine maintenance was not a priority for the earlier version of PARMMS road manager. It also did not take into account the effect of drainage on pavement structural layers.
Significant work has been invested into the pavement model this year to take account of both reactive pavement maintenance and drainage issues whilst still focusing on delivery of KPMs and long-term pavement performance. The model has also undergone significant field validation with operational staff to provide a very strong field–modelling link.
The PSMC001 model is treated as a live program due to the need to:
Please refer to Appendix 18, which contains the PARMMS road manager pavement modelling report.
This annual plan is based on a two year program, 2005/06 and 2006/07, which comprise years two and three of the current ten year FWP, which is included in Appendix 17.
The table and graph below summarise current predicted rehabilitation and reseal requirements to 2013. (Note: Reseal quantities after the coming season do not include SCRIM seals, estimated at 5 km/yr, and risk-excluded second coats, estimated at 7 km/yr.)

The rehabilitation figures shown above are made up from:
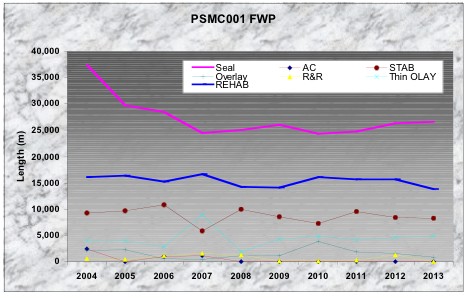
The philosophy behind our 2005/06 programs is to assist in meeting contract KPIs with a strong emphasis on reducing reactive pavement maintenance. This flows through into 2006/07 and future years. To this end the shorter sections emerging from our model have been progressively incorporated into our works program.
The two-year FWP quantity for rehabilitation and reseals has an 80 percent confidence level (when averaged over the two year period). This is in contrast to expectations contained in TNZ memo ST7-0013-Instructions to the 2-year Annual Plan. Reasons for this deviation include climatic and geological conditions, the reality of modelling methodology, “work effects,” and the variation introduced from detailed site analysis prior to construction. An expansion of this rationale can be found in Appendix 17 of the Support Supplement.