U.S. Department of Transportation
Federal Highway Administration
1200 New Jersey Avenue, SE
Washington, DC 20590
202-366-4000
The Safety Applications of Intelligent Transportation Systems scan was jointly organized and sponsored by the Federal Highway Administration (FHWA), the American Association of State Highway and Transportation Officials (AASHTO), and the National Cooperative Highway Research Program (NCHRP). The study began in fall 2004 and continued through summer 2005.
The objective of this study was to find existing intelligent transportation systems (ITS) applications deployed in other countries that could be effective in mitigating safety problems in the United States. Of particular interest to the scanning team were applications that decrease traffic crashes and their severity. Specific examples sought included collision avoidance (including infrastructure-cooperative systems), automated warning and enforcement, severe weather conditions warning, and automation.
The purpose of the international scan process is to build on the successes of the Strategic Highway Research Program (SHRP) Implementation Task Force in the following efforts:
By focusing on these areas, the outcomes of this international scan will assist the U.S. Department of Transportation (USDOT), State departments of transportation (DOTs), and local transportation officials and organizations in gaining a better understanding of issues related to communications, liability, maintenance, life-cycle costs, and effectiveness of such systems, based on the experience of the countries visited. In addition, the potential exists to accelerate the application of countermeasures that can have valuable and long-lasting impact on U.S. highway safety in reducing the number and severity of crashes.
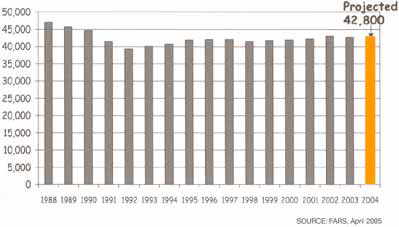
The need is clear for U.S. transportation agencies and officials to acquire information on the application of ITS technologies to enhance safety. Figure 1 reflects the trends in fatality rates in the United States from 1988 through 2004. In the most recent year on record, the total number of fatalities associated with traffic crashes on the Nation's roadways exceeded 42,800. This reflects a slight increase from 2003.
Figure 1: Annual number of fatalities. (www.nhtsa.dot.gov)
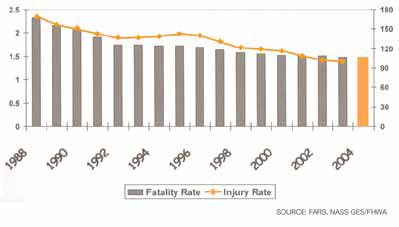
Fatality rates shown in figure 2, indicated as deaths per 100 million vehicle miles traveled (VMT), decreased slightly to 1.46 in 2004 from 1.48 in 2003.1 The decrease in the fatality rate, coupled with a higher number of fatalities, is the result of an increase in total VMT versus total number of fatalities. Transportation officials certainly take no comfort in this almost imperceptible decrease in the fatality rate when more than 42,000 deaths a year still occur on the Nation's highways.
Figure 2: Annual fatality rate. (www.nhtsa.dot.gov)
The impact of these deaths is highly significant in terms of the price paid by families and friends, as well as by employers and others. The impact of injuries from a personal and medical sense is also sobering. The National Highway Traffic Safety Administration estimates that the costs associated with traffic crashes exceed $231 billion per year, which represents 2 percent of the Nation's gross domestic product.2 In responding to this significant financial impact of crashes and their resulting fatalities, automobile insurance rates for injuries and property damage increased an average of 10 percent between 2002 and 2003 alone.3 The timeliness of this international scan and the possibility of leveraging ITS applications already deployed in other countries to mitigate these impacts are clear.
Figure 3: World Health Organization fatality and injury report. (www.nhtsa.dot.gov)
| Nations | Lives Lost | |
|---|---|---|
| Poor Nations | Africa | 170,118 |
| Americas | 125,959 | |
| China | 178,894 | |
| Eastern Mediterranean | 70,677 | |
| Europe | 106,757 | |
| India | 216,859 | |
| South-East Asia | 118,608 | |
| Western Pacific | 41,165 | |
| Wealthy Nations | Eastern Mediterranean | 923 |
| Europe | 66,099 | |
| North America | 49,304 | |
| Western Pacific | 25,330 | |
| Combined Totals | 1,170,694 | |
| Nations | Injuries | |
|---|---|---|
| Poor Nations | Africa | 6,116,559 |
| Americas | 4,410,736 | |
| China | 5,384,909 | |
| Eastern Mediterranean | 2,533,771 | |
| Europe | 3,213,104 | |
| India | 7,203,864 | |
| South-East Asia | 3,997,631 | |
| Western Pacific | 1,432,539 | |
| Wealthy Nations | Eastern Mediterranean | 29,979 |
| Europe | 2,082,321 | |
| North America | 1,670,374 | |
| Western Pacific | 772,838 | |
| Combined Totals | 38,848,625 | |
Traffic fatalities and injuries resulting from crashes are of concern in the international arena as well. The World Health Organization considers the high death rate on roads and highways to be epidemic in proportion to the world population. Figure 3 reflects the organization's findings in the late 1990s, which caused it to be more aggressive in moving to reduce this heavy toll on societies worldwide.
To maximize the value derived from this scan, the panel divided its efforts into two phases. In phase one, a subset of the full panel participated in the ITS World Congress held in Nagoya, Japan, in October 2004. This group attended valuable sessions at the ITS World Congress and participated in a tour of innovations being advanced in Japan on safety applications of ITS technologies. A summary of the Japan phase findings is in Appendix A.
In phase two, the full scan team visited Germany and France. While much can be learned from many other countries in Europe, including England, Finland, Sweden, and Switzerland, the team's limited time required a deliberate and focused series of meetings in only two of the countries where these applications exist.
Accordingly, the panel conducted meetings in both countries with government agencies, the private sector, and members of academia. In addition, while in Japan at the ITS World Congress, panel members met with representatives from many countries not visited, with the intent of gathering further information from their experiences in this study area.
FHWA, AASHTO, and NCHRP sponsored the scanning study. The countries the team visited, with their respective dates, are listed in table 1, and the international contacts interviewed are in Appendix B.
The team selected France and Germany because of their significant deployment and application of ITS technologies with a focus on improving safety in their highway systems. In addition, in Germany the team was able to meet with researchers from the private sector to gain greater understanding of their efforts toward this objective. A major discriminator in making these selections was the fact that both France and Germany had actual deployment of the technologies of interest and had performance data substantiating the value of their application.
Scanning team members were selected to represent a diversity of knowledge and experience so that the ITS technologies examined could be viewed in proper and valuable context for deployment in the United States. The 12-member panel represented FHWA, AASHTO, and academia. The team members have many years of experience in areas such as ITS technology deployment, organizational management, public policy issues, maintenance and operations of road and highway systems, and engineering design and construction. Team members and their organizations are listed in table 2. Contact information and biographic sketches for team members are in Appendix C.
To focus the discussions with each of the public- and private-sector groups the scan team visited, the team developed a series of amplifying questions ahead of time. The scan's area of interest was so broad that the team thought this would assist the groups in preparing their remarks and materials for the team's visits. These amplifying questions were translated into both German and French for the meetings held in the respective countries as a courtesy to those who agreed to assist the team in its study. A list of the amplifying questions is in Appendix D.
This list of questions is significantly pared down from the comprehensive list the scan team developed at the onset of the project. The scope of ITS technology deployment and the array of safety issues of concern to the team members are very broad. However, knowing that time with the host organizations would be limited, the team developed the final set of questions to reflect a thoughtful and deliberate attempt to acquire the most critical information possible for each area of interest. In addition to specific areas of interest (including crash avoidance, pedestrian and bicycle safety, collision-warning systems, and others), each question queries the host organizations on what performance data and measures are available to assess the effectiveness of the deployed strategies. This concern for performance was a deliberate attempt by the scan team to gain insights into the effectiveness of the strategies presented.
The key to moving the transportation industry forward in reducing fatalities, injuries, and property damage lies in finding ways to deploy promising technologies. To this end, the scan team spent considerable time evaluating the information gathered during the two phases of the scan and developed an implementation plan for use at the Federal, State, and local levels. This plan, including details of its implementation, is in Chapter 4.
| Scan Locations | Dates Visited |
|---|---|
| Germany | May 9-11, 2005 |
| France | May 12-13, 2005 |
Table 2: Team members and organizations
| Contents | Next >> |

