U.S. Department of Transportation
Federal Highway Administration
1200 New Jersey Avenue, SE
Washington, DC 20590
202-366-4000
The scan team met with both public- and privatesector organizations in France and Germany. In every case, the host organizations were generous in sharing their latest advancements in applying ITS technologies to improve safety on their road and highway systems. This chapter provides a glimpse into the wide array of applications and initiatives the scan team observed during the course of its study in Europe.
Figure 4: International symbol. |
The team observed many effective means for communicating information to the traveling public via both static and variable message signs (VMS). The Europeans rely on these signs to provide vehicle operators with up-to-date information about traffic conditions, road restrictions, and other situations affecting the safe and efficient use of the facility. In both France and Germany, the use of international symbols (figure 4) is obviously well established (as well as in other EU countries). These symbols, which transcend language barriers among countries, allow for the accurate and clear communication of information motorists need to safely use roads and highways.
This effort, focused on simplifying the communication of information, follows very closely the human-machine interface (HMI) initiatives in both countries, a deliberate effort to provide drivers with only the information that is essential at a critical time in the journey. In a transportation world where drivers are inundated with information (including that provided by typical signing, advertising, and cellular services), the opportunity to relieve the information load through use of symbols in lieu of text appears promising.
Variable or changeable message signs take many forms in the European transportation system. Some signs have standard, changeable legends that can be tailored to communicate, in textual format, key information and data, as shown in figures 5 and 6. Graphical representations of roadway networks and their level of congestion are also not uncommon in Germany, as shown in figures 7 and 8.
Figure 5: Changeable message signs.
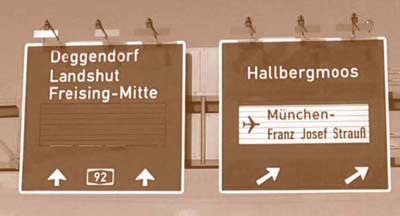
Figure 6: Variable message sign. (BMW)
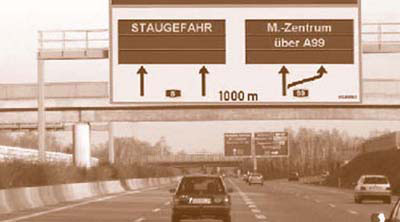
Figure 7: Variable message sign with congestion indication. (BMW)
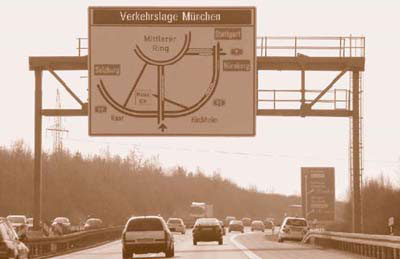
Figure 8: Variable message sign with congestion indication - ground mount. (BMW)
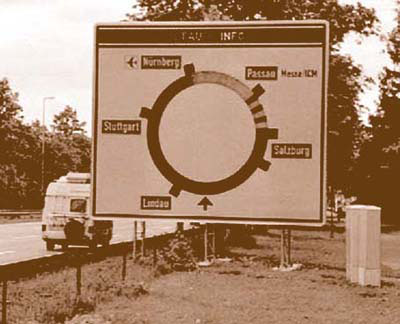
Figure 9: Static overhead sign.
Other signs included a combination of standard messaging and international symbols, providing standard inputs to the driver on road conditions, speed, or warnings.
In addition, observed signing also provided transportation system operators the ability to provide additional routing information for congestion or incident management purposes. The signs also are used to divert traffic from one route to another and often offer the driver a choice by estimating the differences in travel time for provided options.
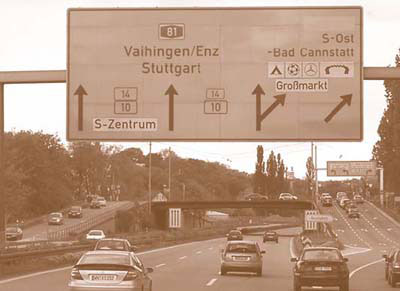
Static signs, as shown in figure 9, are also thoughtfully designed to communicate the maximum amount of information to the vehicle operator in the clearest fashion possible. The scan team observed significantly more use of routing symbols on signs in Europe than in the United States. These symbols and graphics depict movements and give drivers a sense of how routing decisions will occur as they proceed through interchanges on the road ahead. This combined use of symbols and text messages in a static, overhead-signing situation appears to be an effective means of communication.
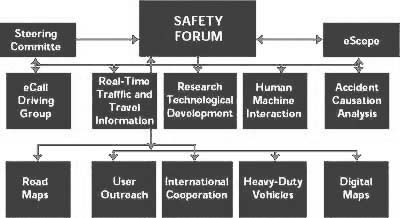
The European Commission established the eSafety effort to advance a significant number of initiatives that will result in substantial safety improvements for those who travel the roads and highways of its member countries. This eSafety Forum (figure 10) is composed of nine working groups whose projects include crash-causation analysis, human-machine interface, and others. Figure 11 shows the organization and reflects the breadth of the individual initiatives in the eSafety initiative.
The eSafety initiative has produced a collective umbrella structure for advancing the many subinitiatives that compose the overall effort. The working groups identified by each box in figure 11 are key to the success of safety, since this is where the technical research occurs and where public-private interactions result in the various products and services developed. Nevertheless, the structure is sufficiently robust at the forum level that key efforts are able to move toward implementation. The team observed that the EU members and private-sector companies who support the eSafety initiative have developed a productive and effective relationship with tangible results from their collective efforts.
The eSafety program is composed of multiple elements that will collectively contribute to the safer operation of vehicles on the roadway. To date, the European Union has committed about EUR170 million (US$212 million) to support the various programs falling within the eSafety research and deployment structure. The vision of the eSafety initiative is divided into two major categories:
First-generation systems focus more on the vehicle as an isolated unit capable of gathering some external inputs but operating mostly within its own sphere of information. The following three descriptors offer insight into how this is accomplished:
To move the eSafety effort forward, European Union has established what it calls second-generation initiatives, which will manage the vehicle's performance in the context of the overall system. The vehicle is no longer seen as a singular element in the roadway environment; instead, all elements (including other vehicles and the infrastructure itself) work together as a system. The two descriptors offered for this second-generation eSafety system are the following:
Many systems the scan team observed are elements of the EU eSafety initiative. PReVENT is one of these systems. With EUR55 million (US$69 million) dedicated over 4 years, the purpose of the PReVENT effort is fivefold:
Each specific area constitutes a focus of intense research to provide safer operation of vehicles on EU roadways. Transportation professionals will recognize the logic behind these five areas and see why research on each would lead to safer vehicle operations.
Figure 10: eSafety Forum logo. (www.escope.info)

One challenge facing emergency response resources is timely notification. Similarly perplexing is the issue of responding with the proper personnel and resources to address a specific incident and its victims. In many cases, the individuals first on the scene were not traditional law enforcement or medical personnel, but auto club employees or others. In response to this important need, the EU eSafety initiative continues to examine many of the human-machine interface initiative's components, including notification following an incident. One such component is the eCall system in preliminary development in Europe.
eCall is an initiative that will allow a motorist to either automatically or manually communicate with a Public Service Answering Point (PSAP) when an incident occurs. PSAP then notifies appropriate emergency service organizations so they can respond quickly to the situation. During this communication process, PSAP personnel will assist the reporting vehicle operator in addressing immediate needs at the scene of the incident. Simultaneous communication of critical health and safety information can be sent to the proper emergency organizations so that the response is tailored to the specific circumstances. Additionally, the GPS component of the eCall initiative will allow emergency response resources to go to the precise location of the incident without wasting precious minutes searching for the caller.
The European Commission has adopted a plan to equip all new cars in Europe with eCall as soon as 2009. eCall will join already-deployed cellular communications systems with GPS, facilitating precise location of incidents as soon as they occur. It is anticipated that 2,000 lives a year will be saved in Europe as response times are reduced by up to 50 percent in rural areas and 40 percent in urban areas.
Figure 11: eSafety Forum organization chart.
Creating an environment for safer vehicle operation is a major objective of a number of projects. Image processing falls under the broad umbrella of the advanced driver assistance systems (ADAS) effort, part of the eSafety initiative. Image processing centers on capturing various images, processing the information received, and communicating it to drivers to enhance their ability to safely control their vehicles.
A vehicle can gather image information from a variety of sources. These include video, laser, radar, and other inputs from the infrastructure itself. Video cameras may be located strategically around a vehicle, providing 360-degree inputs of the environment immediately next to and ahead of the vehicle. Once gathered, these video images are processed with data gathered from other sensors and intelligent outputs are then provided to the driver for use in making critical decisions.
Technology under development uses image processing to help the driver recognize infrastructure features, traffic-control devices, and other key environmental elements surrounding the vehicle. For example, a video camera could capture the image of a typical octagonal stop sign. Once that image enters the processor, it is interpreted as a traffic-control device and more particularly as a stop sign. At this point the onboard processor can communicate to the driver the proximity of a stop sign as the vehicle approaches that location. In carrying this example further, the onboard processor could sense that as the vehicle approaches the location of the stop sign it is not decelerating appropriately for the current speed and road conditions. If the vehicle were also equipped with an automated braking system, the driver would be prompted to begin braking or automatic braking could begin to avoid the car driving through the stop sign.
Other uses of image processing include detection of speed limits, traffic signals, and other traffic-control devices, as well as anomalies that may occur in front of or next to a vehicle. The images are processed based on the shape or form of the device, as well as its color, texture, and optical characteristics. The onboard processor is capable of taking the many images captured by the vehicle's sensors and sorting them so that only those that reflect specific safety needs are processed and interpreted for the driver.
One example presented to the scan team during its visit to BMW in Germany showed how images of signs are first captured by their shape and other physical characteristics. Then, as the vehicle gets closer, further details of the sign's characteristics are determined through a series of algorithms until the message is clearly known and communicated to the driver.
Examples of opportunities to use image processing for safer driving include pedestrian and hazard detection. Hazards would also include safety concerns such as disabled vehicles, construction work zones, and obstructions in the roadway.
Over the years, France has developed an extensive system of toll roads that cover much of the country and provide significant mobility to residents and visitors alike. Authorized in national legislation in 1955, tollways totaling 7,973 kilometers (km) are operated by 11 concessionaries with more than 76.3 billion km traveled each year. Total annual toll revenues across these systems have reached EUR6.1 billion. Many efforts have been undertaken to streamline the collection of these tolls. In a given year these tolls are collected by the following means:
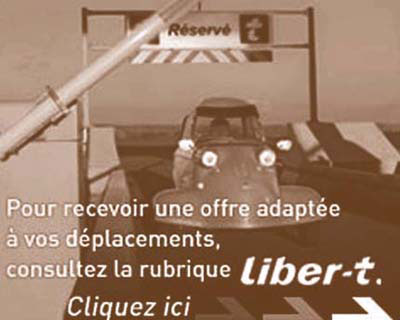
The Liber-t system (see figure 12) was established to provide transparency among the tollways and make traveling around the country more convenient. With more than 1,156,000 subscribers, the Liber-t transponder system allows a traveler to move freely from one tollway to another knowing that tolls will be accumulated at a central processing center where one invoice will be generated, no matter where the travel occurred. Recognizing the mobility between adjacent countries and the existence of other tollways around Europe, other EU countries are moving to assure this same transparency.
Liber-t provides many incentives to its users in addition to the single-invoice feature. Discounts ranging from 10 to 20 percent are offered to frequent travelers who use the same route 10 or more times a month. If the same journey is made more than five times a month, then the sixth and tenth trips are free. Further enhancing the use of the Liber-t system is the current development and future deployment of its use in parking garages and for other motorist services. Ultimately, systems like Liber-t will make travel more efficient and provide desired transparency to users as they move from one system to another.
Figure 12. Liber-t. "To receive an offer adapted to your travels, consult Liber-t's information
page. Click here." (www.autoroutes.fr)
Two systems that have developed simultaneously in the transportation industry are digital-mapping initiatives and onboard navigation systems. In the European Union SafeMAP effort, public-sector agencies and private-sector firms work together to combine these technologies to bring a higher level of service to the driver. SafeMAP focuses on six assistance features:
For SafeMAP to be effective, the static and dynamic features of the roadway must be integrated into digital maps that become part of the onboard navigation system provided in the vehicle. Static information includes speed limits, roadway features, geometrics, and so forth. Dynamic information includes crash data, weather conditions, construction work zones, and other data that change with time. Combining these inputs with an onboard navigation system and its GPS capabilities provides the vehicle operator with an information-rich environment that will lead to a safer driving experience.
In some cases the data will warn drivers of a geometric feature or an area prone to icing. Perhaps the warning will alert the driver to a location with a higher-than-normal number of crashes. Other situations might include warnings that an intersection is ahead or the posted speed limit is being exceeded. While the use of a static digital map can be valuable to the vehicle operator, the combined effect of both static and dynamic information on the environment the vehicle is traveling in will be a powerful application of the ITS technologies the scan team observed. Ultimately, SafeMAP will allow the driver to focus on making key decisions with pertinent and timely information.
The scan team observed several significant speed-management and -enforcement initiatives in its review of safety applications in Europe. In particular, France is making a clear effort to address excessive speed and its contribution to crashes, with their resultant injuries and fatalities.
One system the team observed is an experimental speedcontrol effort on the A7 Motorway operated by Autoroutes du Sud de la France (ASF). ASF officials are concerned about increasing levels of congestion all along the A7 corridor, but especially on the section between Valence Sud and Montélimar Nord. Managing speed or, more specifically, creating an environment with more consistency in the speed level is the objective of this experiment on the A7 Motorway. Speed control is just one of the measures ASF is implementing to improve the driving experience within the system.
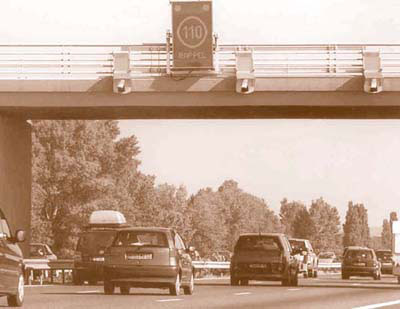
ASF's strategy is to provide advisory speed notices to motorists as they travel along the A7. Overhead gantries are used to both measure speed and communicate to drivers that they are exceeding the posted speed limit. Cameras take images of vehicles at two points 10 km apart. The resulting speed calculations are used to identify vehicles exceeding the posted speed limit.
Figure 13 shows a typical application of the cameras and variable-message sign communicating speed information. Multiple installations such as the one depicted in this figure provide ASF with sufficient information to notify motorists of their speed compliance.
Figure 13: Enforcement cameras and speed limit signage on the A7. (French Ministry of Transport)
Initially, the message posted on the variable-message sign was generic. In the second phase of the speed-control effort, however, researchers will assess public reaction to the posting of license plate information for more specific communication of speed violations to motorists. No citations are issued in either case. Rather, the objective is to inform and encourage speed compliance.
Preliminary results are encouraging. ASF measured a nominal 3 percent increase in capacity on the A7 where this system is in place. In addition, it found an 80 percent compliance rate in areas where the posted speed limit was 110 kilometers per hour (km/h) and a 50 percent rate where the limit was 90 km/h. This seems to indicate greater compliance at speeds where the drivers are more comfortable with the rate. Conversely, it appears that an unnatural attempt to control speed at a lower level than drivers believe is appropriate does not result in as high a compliance level. Other results include overall reductions in the maximum speeds measured. Also, ASF noted that the reaction time for motorists to voluntarily respond to a newly posted speed limit was about 5 minutes from the time the new speed limit was posted.
ASF's motto for its system, "Gain time by driving slower," appears to have merit as further efforts are made to improve the driving experience and safety aspects of the A7 Motorway.
The final and most aggressive speed-management initiative observed was implemented by the French Ministry of Transport and reflects a comprehensive approach to using enforcement to reduce crashes and their resultant injuries and fatalities. In defining its enforcement policy, the ministry adopted three objectives:
One of the first steps adopted in moving this initiative forward was to ensure that the legal framework was in place. The success of the system required non-law-enforcement personnel from a central location to have the authority to issue citations. This central location is known as the Public Prosecutor, which has the authority to remotely cite vehicles because of special validation conditions imposed on the camera system on the highway.
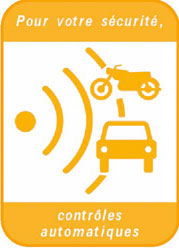
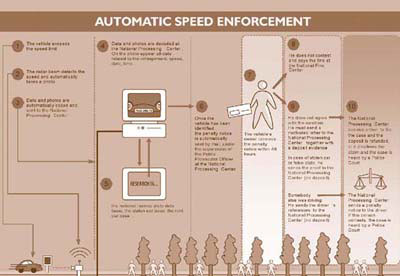
Once the legal framework was in place, the technological components were implemented to include fixed sites as well as mobile units. Initially, 70 fixed cameras were put in place (see figure 14), allowing for each French driver to be "enforced" twice a month. The ministry's 2005 goal was to have 1,000 fixed and mobile cameras in place. To designate areas where enforcement is occurring, special signing was installed to warn motorists of the presence of speed cameras (see figure 15). Site maps on the Web also show enforcement locations. Figure 17 depicts the overall process from violation through adjudication.
A major point the ministry made about its speed enforcement initiative is the clear and unequivocal support it has received from political leaders. The very visible endorsement of these strategies by national leaders communicates to the public the importance of taking safety seriously on the motorways.
Figure 14: Fixed speed enforcement camera. (French Ministry of Transport, DSCR)
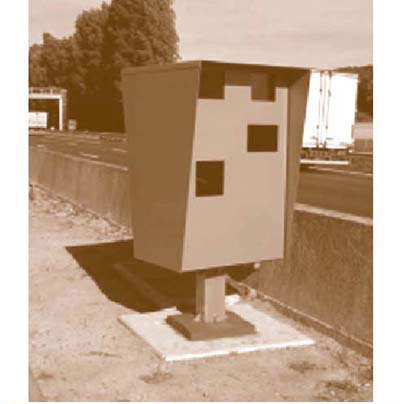
Figure 15: Speed enforcement signage. (French Ministry of Transport, DSCR)
The results of this effort by the ministry are noteworthy. Speeding violations decreased from almost 7 percent to less than 3 percent in areas where camera enforcement was in operation, as figure 16 shows.
Figure 16: Measured results of automated enforcement. (French Ministry of Transport)
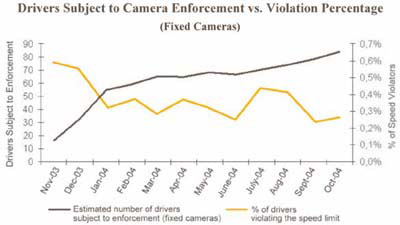
Figure 17: Automatic speed enforcement process diagram. (French Ministry of Transport, DSCR)
In addition, these sites showed a dramatic 85 percent reduction in crashes in the 10-month study period. The ministry also noted a general decrease in speeding violations elsewhere on the motorway network, even in locations with no cameras. Public reaction to the cameras includes an admission by 86 percent of drivers that their speed reduction was a consequence of the presence of the speed cameras and recognition by 77 percent that this automated speed enforcement system improved road safety.
Another effort is called LAVIA (figure 18), a French project focused on intelligent speed adaptation in which a governor system automatically limits a vehicle's speed to the locally posted limit. This governor controls the vehicle's maximum speed under three conditions described below. Under this system, the vehicle's accelerator pedal has no effect when the vehicle is traveling at the prevailing speed limit. For safety purposes, however, the system includes a feature that allows the driver to "kick down" the accelerator in an emergency to avoid a crash or hazard.
Figure 18: LAVIA logo.
LAVIA, now in early trials, is providing valuable information to transportation researchers. In its tests, LAVIA is comparing three modes of operation:
For the LAVIA system to work, a sophisticated digital mapping system must be operative, making detailed speed information available for the network. In the vehicle, an onboard navigation system with GPS capabilities works in conjunction with a digital map containing speed data. The LAVIA controller merges the digital map information with both GPS data and readings from the vehicle's speedometer and reacts accordingly to control the speed of the vehicle.
To date, the trial size does not allow for conclusive statements on the safety aspects of the LAVIA system. However, researchers intuitively believe that controlling speed will result in safety benefits. Results indicate public acceptance of such a system at 31 percent, while 23.5 percent oppose giving up control of the speed of their vehicle. In addition, this study points to the clear need for accurate and appropriate speed limits to gain the confidence of drivers in allowing the LAVIA system to control this aspect of the vehicle's operation.
Another use of sensors involves communication of speed information to vehicle operators. Speed uniformity and management are seen in the European Union as major contributors to greater highway safety. The TPA speed horizon project (figure 19) is part of the INVENT initiative. A speed horizon is a speed profile ahead of an operator's vehicle that functions by means of onboard sensors, inter-vehicle communication, and a modelbased observer. It is the key for the following:
Figure 19: TPA speed horizon system. (INVENT, DaimlerChrysler)
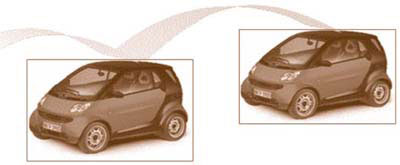
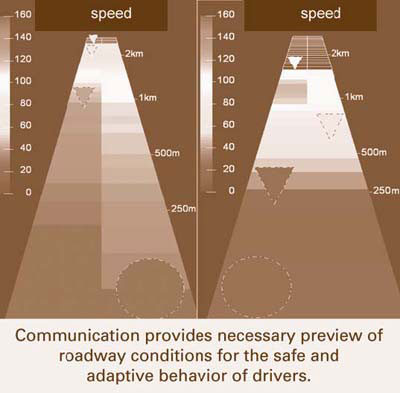
This process of intervehicle communication allows the onboard processor to create a vision of the operating speeds of the vehicles ahead, enabling the driver to compensate or react accordingly. The speed profile, as depicted in figure 20, provides operators with enhanced knowledge of road conditions up ahead. For example, knowing about congestion adjacent to a roadway exit 0.5 km ahead, as the right side of figure 20 shows, allows the operator to modify his speed and change lanes if necessary before that location.
Knowing other vehicles' speeds will help vehicle operators make informed and safe decisions as they move forward on the roadway. Advance notice is recognized by both the private- and public-sector organizations the scan team visited as a major safety enhancement for timely decisions by the vehicle operator.
Figure 20: Speed profile diagram. (INVENT, DaimlerChrysler)
In Germany, the federal highway agency's research arm, Bundesanstalt für Strassenwesn (BASt), has undertaken an initiative in intelligent speed management. It is coordinating this effort with the SafeMAP project discussed earlier. The safety advantages to the driver of integrating specific speed information with digital maps located in the vehicle's onboard navigation devices are clear. The challenges BASt sees cover a variety of areas, including the ability to communicate up-to-date information to the vehicle's onboard system, the accuracy of GPS and its integration with digital maps, and the collection of pertinent data and information to make the system function effectively.
Although the BASt effort is still in the early phase, researchers have arrived at a number of conclusions that will guide their efforts in moving forward:
It is clear that safety benefits will accrue from Germany's speed management research efforts as they are implemented on that nation's roadway system.
One of the most extensive penetrations of ITS technologies around the world involves video surveillance of transportation networks. This ability to view activities and operations on bridges, in tunnels, and on highways has proved to be a valuable tool for transportation managers in maximizing the efficiency of their systems. Over the years, the challenge has been to find a means whereby numerous camera images can be processed in an automated manner that will enable system operators to respond to incidents with accuracy and in a timely manner.
A technology developed in France and observed by the scan team focuses on this ability to precisely interpret video images, discern anomalies, and alert transportation professionals to events occurring on the network. In addition, these images can be used to address emergencies in a timely manner and offer transportation agencies enhanced security inputs for critical facilities. To accomplish this complex task, specific steps are followed once the cameras are in place and operational:
Sophisticated algorithms are used to analyze about 20 percent of the images captured by each camera every second. From these images the system is able to discern when anomalies have occurred and, when properly filtered, offer system operators timely alerts to potential problems. In addition, the analysis not only provides the most current image of the area where an incident occurred, but also images of activities that occurred just before the event. In this way, much more relevant information can be secured to enable the operator to make the correct response decision. While many attempts have been made over the years to develop an automated system for video incident detection, the technology and computational abilities of the systems were not robust enough until now to provide accurate and timely notification of incidents using the video feeds already being captured. The systems the scan team observed are a clear indication of the potential that video image processing can have on improving safety on the U.S. highway network.
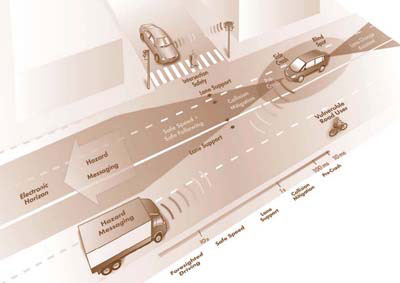
The WILLWARN (Wireless Local Danger Warning) system (figure 21) is another element of the PReVENT initiative. It focuses on providing the driver with critical information on which safe driving decisions may be based. It centers on car-to-car communications in which critical information is exchanged between adjacent vehicles. As these inputs are analyzed by an onboard processor, an "electronic" horizon is created, giving the driver an enhanced view of the road ahead. Figure 22 depicts how information from the WILLWARN system and from other components of the PReVENT project is gathered from many sources adjacent to the vehicle to create this "electronic" safety environment.
Figure 21: WILLWARN logo.
WILLWARN has an onboard capability that offers the following to the vehicle operator:
The applications of the WILLWARN system are numerous. It will allow for safer driving conditions in rural areas or where severe weather or other difficult conditions make travel hazardous. Potential obstacles or hazards in both urban and rural areas will be highlighted to the driver through WILLWARN, offering opportunity for evasive action. In areas of low visibility, the inputs provided by this system will give drivers key information about road situations ahead that will allow them to travel safely. Finally, inputs on construction work zones will promote safety for both drivers and workers in the construction area. WILLWARN is yet another means for gathering information from a variety of sources, processing that information, and presenting it to the driver in a format that is not distracting to the safe operation of the vehicle.
Figure 22: PReVENT project approach.
Tort liability is one of the major challenges facing the European Union. It is a worldwide issue, with every country and technology implementer concerned about how crashes or other incidents might turn into major legal issues. To deal with this problem, the European Union has established a Code of Practice that defines roles, responsibilities, and "duty of care" that providers and operators have in deploying ITS safety systems.
The Code of Practice is not a new concept. Other industries, such as aircraft manufacturers and the pharmaceutical industry, have adopted such a document to stem, to whatever possible degree, the tide of litigation that may result from product failure. In many respects, highway industry standards such as the FHWA Manual on Uniform Traffic Control Devices (MUTCD) and others are examples of codes that organizations can follow and rely on. In Japan, officials have adopted the Japanese Industrial Standards (JIS) as their equivalent code.
The EU Code of Practice offers a risk assessment that translates product development and deployment into "reasonable safety" performance standards. By following these guidelines, product developers or system operators can be reasonably sure that their activities meet accepted expectations for safety and utility. One important aspect of the Code of Practice is that it provides the definition of "safe" for entities involved in developing the elements of the advanced driver assistance systems (ADAS) discussed elsewhere in this report.
As products or systems are developed in the European Union, they go through a series of queries that assist the developer in determining whether the concept will meet the Code of Practice in a real-world application. Typical questions that must be answered include the following:
By answering these and other questions, product developers can determine if they have met their "duty of care" for a given product and complied with the Code of Practice, thereby qualifying to benefit from its protections.
To date, the ITS community and its related contributors have not developed a U.S. version of a code of practice. Those who hosted the scan team in Europe clearly stated that the deployment of some of the most impressive and valuable technologies could not occur until such a code is in place.
The French Ministry of Transportation has embarked on a research effort called SARI as part of its PREDIT program. SARI has its impetus in the notion that roadway safety can be improved if drivers are provided appropriate information to avoid surprises in their decisionmaking processes. The objectives of the SARI research effort are as follows:
French transportation professionals believe that warning drivers of road conditions as they approach specific locations will improve their ability to operate vehicles in a safe and prudent way. This creation of a safer driving environment depends on providing accurate and timely information to drivers. Conditions that may be communicated include challenging geometry, highcrash locations, weather or visibility conditions, and other pertinent inputs that would impact vehicle operation.
Research will be conducted in five principal areas:
The results of this research will be valuable as transportation professionals strive to more accurately determine how best to communicate information to drivers to improve their performance on the roadway.
The scan team observed a number of other initiatives presented by the public and private sectors in the European Union that focused on helping the driver with various tasks and operations. A joint public-private effort that concentrates on these systems functions under an umbrella called INVENT, a collection of projects that focus on driver assistance and active safety.
The individual projects in INVENT are divided into five categories:
Within the detection and interpretation of the driving environment are efforts to enhance information collection through individual types of sensors (e.g., cameras, laser, etc.). What is perhaps more significant is that the efforts also incorporate the concept of sensor fusion, meaning data is gathered by more than one method or collection device and combined. This combination of inputs develops synergy, and the ultimate effect of this fusion concept is a richer information environment for the driver. One goal of creating this environment is to offer early detection of moving objects, allowing a vehicle operator more time to make critical operational decisions.
In the anticipatory active safety category, efforts are divided among a variety of research projects that promise many safety benefits. Included are systems that focus on crash prevention and the reduction of their severity as well as protection of all participants in the traffic flow, including vehicle operators, passengers, pedestrians, and cyclists. Under development are technologies to help drivers make safer lane changes and maintain their lane position, as well as proximity sensors that communicate relative position of the vehicle and other roadway features and occupants. Key to this category is the word "anticipatory," since the technologies being assessed and deployed offer an "intelligent" look at the current and possible future conditions surrounding a vehicle on the highway.
Congestion assistant systems are designed to help a driver with tasks that can cause fatigue during periods of high congestion on the highway. System benefits include the following:
Ultimately, use of these systems will greatly reduce many repetitive driving tasks and allow the driver to focus attention on more critical driving decisions.
Driver assistance can be provided in many forms. In some cases, the driver is fully aware of the systems and interacts with information received from a variety of inputs as described above. In other cases, this assistance is provided in the background and the driver often is unaware of the help provided. An example is the electronic stabilization control (ESC) systems being installed on many late-model vehicles in Europe and the United States. These ESC systems assist the driver when certain performance circumstances present themselves on the roadway. When operational, an ESC system will assist a driver in steering and movement maneuvers that will help him keep the vehicle safely on the roadway and avoid over turning or some other outcome. The significant benefits of ESC systems are shown in figure 23.
Figure 23: Crashes in Germany 1998-2002: loss-of-control crashes.
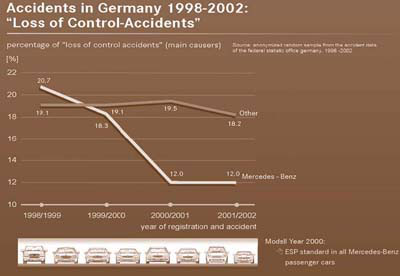
In this case, the data is solely for one manufacturer's vehicles, but the point is clear that benefits are substantial for all vehicles equipped with an ESC system.
In the Munich area the scan team visited the Traffic Operations Center (TOC) of the Autobahndirektion Sudbayern, the regional transportation agency. The team noted many interesting features of this facility and its contribution to traffic management in the area. One in particular the team found valuable was a deliberate effort to maximize the throughput on the highway network by using two strategies: active routing and shoulder running.
Active routing of traffic flow was accomplished with an aggressive use of changeable message signs that allowed TOC to offer alternative routing information to motorists to reduce the congestion on specific routes. Changeable message signs would communicate this information in the form of routing options, distance, and time consequences. Drivers could then make informed decisions on how they would traverse a certain route based on enhanced information provided by TOC.
In addition, TOC thoughtfully used shoulder running during periods of peak congestion to maximize the use of available pavement surface to carry traffic on the system. Several measures were implemented to ensure the safety of those using shoulders. For example, before opening a lane to traffic, TOC surveyed the complete length through video cameras to ensure no disabled vehicles on the shoulder would create a hazard. In addition, signing, striping, and other traffic control devices were modified to accommodate the temporary use of shoulders for traffic flow. Ultimately, shoulder running has proven very successful for the Autobahndirektion Sudbayern. While shoulder running per se is not an ITS technology, it is a concept whose safety and effectiveness depend on appropriate use of these technologies.
One characteristic of the approach taken in Europe to transportation safety is the holistic view the European Union has of the process. The European Union looks at the driver, environment, infrastructure, and related policy issues and attempts to synchronize all of these into an approach that makes significant improvements in safety performance. It recognizes that achievements in only one of these four areas will fall short of the overall goal of reducing traffic fatalities and injuries by half in the next decade.
The scan team found the visits to Germany and France valuable in achieving the objectives of the scan tour. The technologies observed offer clear promise for improving safety on U.S. roads and highways.
| << Previous | Contents | Next >> |


