U.S. Department of Transportation
Federal Highway Administration
1200 New Jersey Avenue, SE
Washington, DC 20590
202-366-4000
This chapter describes the findings from each site visit, some focused on a particular city and some focused on all demand-side initiatives in a country. For each case study, a context is provided and key measures are described, organized by the four types of demand management enumerated in the last chapter: physical, operational, financial/pricing, and institutional. The role of and examples of performance measurement are also discussed.
"All roads lead to Rome" is a notion that many associate with the imperial period of Roman influence. However, those same roads are now choking the very livelihood that made Rome great. The city of Rome has a population of 2.8 million inhabitants and 1.5 million jobs. The Lazio region, with Rome at its center, has more than 5 million people. Almost 2 million cars and more than 500,000 motorcycles and motor scooters are registered in Rome. The mode split for travel in Rome is 60 percent private vehicle and 40 percent public transport and walking. The pressures of so many people and vehicles have created two interrelated problems, traffic congestion and environmental degradation.
Therefore, Rome's General Traffic Master Plan includes a central strategy to improve mobility, modify mode split in favor of public transport, increase traffic safety, decrease air and noise pollution, safeguard health, and preserve Rome's historical and architectural heritage. The strategy is to discourage or prohibit private car use in the core and gradually relax these restrictions outside the core. At the heart of this strategy is demand management, in keeping with the EU policy on sustainable transport.
Figure 9. Historic center of Rome.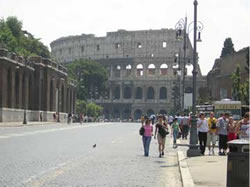
The urban traffic strategy involves five concentric zones (figure 10) emanating from the historic core with increasing constraints on the automobile, especially gross polluters, as one gets closer to the center. In the historic core, measures have been implemented to restrict access to the private car and to improve public transport. Within the "Railway Ring," noncatalyzed cars are prohibited and parking pricing is used. At the "Ring Road," an extensive system of park-and-ride lots and public transport improvements has been implemented to increase the share of commuters and other travelers entering the city by public transport.
Figure 10. Concentric zones for automobile restrictions in Rome.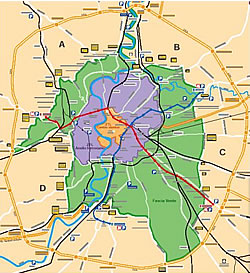
The key institutions involved in maintaining mobility and accessibility in Rome are ATAC SpA (Agenzia per i Transporti Autoferrotranviari del Comune di Roma), the Agency for Bus and Railway Transport in the municipality of Rome, and STA (Servizi per la Mobilita del Comune di Roma), the Mobility Agency for Rome. ATAC is responsible for all public travel and STA for private travel. ATAC is a newly formed (1997) public company of the city of Rome charged with managing mobility. During 2005, STA became part of ATAC. ATAC was created, in part, to help privatize some of the public transport services and reduce the operating deficit of the system. STA also is responsible for working with Roman companies to comply with a national mandate to implement employer TDM plans for all worksites with 300 or more employees.
Rome has implemented several physical measures to restrict access by cars and improve public transport services and quality, including access restrictions, public transport improvements, and installation of ITS infrastructure.
In 1989, the city of Rome adopted a limited traffic zone (ZTL) to reduce the number of cars clogging and polluting the innermost core area, using an access control system (ACS) that relied on paper permits and police enforcement employing barricades. In 1994, the ZTL was expanded and a penalty was introduced for being inside the zone without a permit. Finally, in 1998 an automated ACS was approved, largely pushed by local, national, and European environmental policies. The ZTL covers about 5 square kilometers and has 22 access points, as shown in figure 11.
Figure 11. Limited traffic zone boundary map.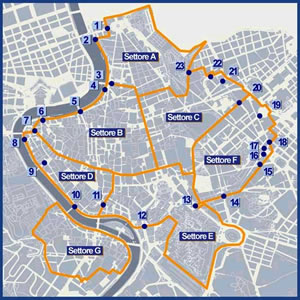
The automated system uses a dual system of onboard units (OBUs), or transponders, and photo enforcement using automated number plate recognition (ANPR) software. The access control system became fully operational in 2001. STA manages the access control system and has issued about 150,000 permits to various authorized users, including resident, nonresident, disabled, taxi, delivery, etc.
Figure 12. ZTL access point.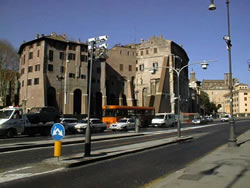
A significant part of Rome's strategy to reduce car use is to improve the public transport system, both in terms of expansion and modernization. Each year, Rome's bus system carries 880 million riders, the tram system moves 46 million passengers, and the underground system transports another 265 million riders.
Some 350 km of new urban rail are being constructed, including new tram lines that were inaugurated for the Roman Catholic Church's 2000 Jubilee Year. The national and regional rail systems have been reoriented to serve as more of a commuter rail system with integrated fare payment and 15 new park-and-ride connections at suburban rail stations. Another part of the public transport strategy is to use clean and electric vehicles in the historic core. New trolley bus lines are being implemented, including one hybrid line (Line 90) that uses overhead power until it reaches the center and then uses battery power (figure 13). Rome boasts Europe's largest electric bus fleet and has about 500 clean fuel buses as well. Finally, Rome offers the public a fleet of electric scooters and recharging stations, many at park-and-ride lots, to provide a clean alternative to motor scooters.
Figure 13. Hybrid trolley bus in Rome.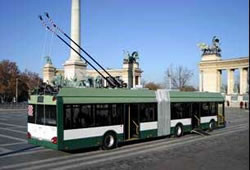
Many ITS applications were implemented in anticipation of the millennium, which corresponded to World Youth Day and Jubilee Year events in 2000, many of them in 15 months. They included traffic control systems (for 400 signals and 48 variable message signs (VMS)), as well as management and monitoring (60 cameras) of entry to the access control zone; fleet management systems to monitor public transport, charter buses, and taxis; integrated ticketing and fare payment systems; and traveler information systems.
Many of the operational strategies, which support demand management, involve the integration of services, information, and payment systems, and other complementary measures.
ATAC now coordinates all bus, rail, and tram services, and soon will be responsible for traffic management as well. Information integration refers to both pretrip and on-trip information, delivered through various means, including the Web, cell phones, kiosks, onboard displays, and in-terminal monitors. ATAC's Web-based route planner software includes photos of many of the bus stops on the system. Information on service status is available by radio in the underground metro system. Variable message signs near ZTL access points also inform users of current conditions (figure 14). By the end of 2005, ATAC planned to have real-time information for its entire fleet to monitor service quality and performance on the entire system. Ultimately, the public transport and traffic control systems will be fully integrated to manage public and private vehicles throughout the system. Finally, electronic payment is being implemented using smart card technology and other forms of electronic payment. One concrete example of this integration is the METREBUS pass. Holders of annual METREBUS multimodal tickets can park free at the park-and-ride lots (13,000 spaces) and use public transport to access Rome.
Figure 14. Variable message sign at ZTL access point.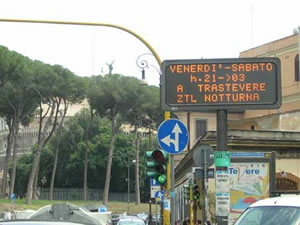
Several complementary measures have also been implemented, some under the auspices of the EU CIVITAS MIRACLES program. One involves collective taxis that serve a niche between a conventional taxi and a bus. Eight passenger vans are used on eight lines that involve route deviation. Users book seats in advance through a call center. The Roma car-sharing service has been implemented for the occasional needs of users who do not have a car or who may avoid the purchase of a second car. Some 300 members belong to the car-sharing service, have access to a clean fuel vehicle, do not pay parking fees in the center, have access to the ZTL, and can use lanes restricted to taxis and public transport vehicles. This new form of collective car ownership is popular in Europe and is being piloted in the United States.
Figure 15. Car-share vehicle in Rome.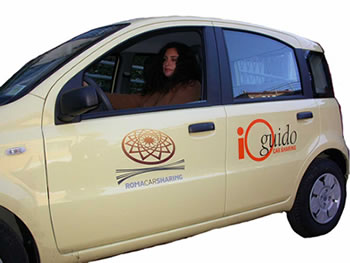
Finally, as mentioned above, the city of Rome has responsibility for working with companies to implement mobility management programs. Each worksite with 300 or more employees is required to have an in-house mobility manager and develop a TDM plan. STA provides technical support and training to these managers and assists with plan development and implementation. In one case, ATAC cofinanced a new employee bus service to one of Rome's major universities.
One good example of demand management for an unplanned major event involved the death and funeral of Pope John Paul II. Given the overwhelming flood of mourners into Rome, ATAC worked with other agencies and existing public transport users to develop a shuttle system that offered free, 24-hour service between the Termini train station and Vatican City as well as other shuttle services for Romans. This service required the use of more than 100 vehicles that were taken off existing routes. To spare these vehicles, the rest of the system adopted a Saturday schedule (60 percent of weekday service levels).
The key pricing measures being implemented in Rome are road pricing and parking pricing.
The access control zone described above involves the sale of annual permits to nonresidents to allow certain users to enter the historic core. Nonresidents (employed in the zone), who comprise 17 percent of the permit holders and 23 percent of the daily users, are tightly controlled and must pay US$425 (€340) per year for a permit and must prove that they have an offstreet parking space for their use. The violation rate is about 5 to 8 percent and the penalty is US$85 (€68) per infraction. The system generates US$72 million (€58 million) in permit and penalty revenue per year against operating costs of US$4 million (€3.2 million).
After 3 years of operation, evaluations have revealed that traffic flows have decreased by 15 to 20 percent, average speed in the zone has increased by 4 percent, and public transport use is up by 5 percent as a result of the ZTL and pricing scheme. At the same time, however, the use of two-wheeled motor-driven vehicles has increased by 10 percent (partially to get around the permit fees using moped, motor scooters, and motorcycles). Since many of these are highly polluting two-stroke engines, the environmental impacts of the access control zone may be negligible (although policy changes are being contemplated to overcome this unintended effect). There does not appear to have been a negative effect on businesses in the core because accessibility and walkability have increased as a result of fewer cars, but merchants are still mixed on their attitudes toward the access controls. New access control zones have been added to popular pedestrian areas with expanded hours into the evening.
Rome estimates that over half of the unbuilt (without buildings) area of the historic city core is occupied by automobiles. Rome has more than 65,000 onstreet parking spaces. The blue zone, or core, includes 6,200 parking spaces controlled by automated payment machines that cover multiple spaces. Rome collects more than US$28 (€22) million from its parking system, or an annual average for US$588 (€470) per parker. There are three means for paying parking fees. The first is a paper ticket distributed by automated machines. The second is an "electronic wallet" debit OBU that can be activated when parking. Finally, cell phones can be used to pay for parking using Global Positioning System (GPS) technology. This provides real-time information to STA to track parking use. Within the core, variable pricing has been implemented to manage parking demand. Parking rates vary by time of day and location and range from US$0.63 (€0.50) to US$1.88 (€1.50) per hour.
Revenues from access permits, parking charges, and violations derived from private transport are reinvested in collective transportation, such as new tram lines, clean trolley buses, car sharing, and other services.
The new organizational model to provide for mobility is called the "Roman Model," which combines public oversight for planning, regulating, and monitoring mobility with outsourcing of service delivery through competitive bidding. Indeed, as STA is merged with ATAC, public transport and traffic management will be combined into a single entity, allowing for the integration of resources, information, operations, etc. Both organizations now provide traveler information on traffic conditions and public transport service, and the merging of the two will fully integrate this information to provide one source of public and private transportation information.
One reason for creating ATAC as a limited public corporation was to allow it to have access to capital markets that the municipality would not have. Therefore, ATAC has restructured the public debt of the public transport system and is reducing the overall deficit through asset management (ATAC owns all of the vehicles), new revenue sources, and reduced operating costs through competitive tenders for service delivery.
Rome is increasingly relying on performance measurement to create an efficient and effective transport system. ATAC monitors the performance of contract service providers to assess ontime reliability. This information is used to penalize operators who do not meet contractual standards. In fact, the service contracts include payment penalties for missed and late runs and this has improved service quality and rider satisfaction.
Staff members at STA and ATAC believe that access control and road pricing are an effective combination and that one key to their success is the careful management of the permitting, enforcement, and monitoring processes. A principal finding from Rome is that access control and pricing have reduced congestion in Rome's historic core, but increases in motor scooters and motorcycles might offset the environmental benefits. Rome is taking steps to integrate motor-driven cycles into its demand management scheme.
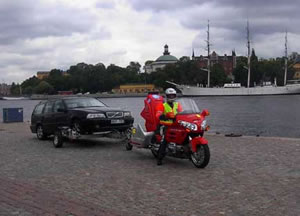
Stockholm is a dynamic city located on 14 islands where Lake Mälaren opens into the Baltic Sea. Only two major bridges provide access into central Stockholm and each carries 120,000 to 130,000 vehicles per day. Some 240,000 commuters enter the city each day from a region with 1.8 million inhabitants (760,000 in the city of Stockholm). While Sweden is experiencing traffic growth of 1.5 to 2.0 percent a year, Stockholm's traffic is increasing at twice that rate, even though the share of peak commuter trips carried on public transport is an impressive 75 percent.
Figure 16. Central Stockholm.
One solution strategy involves the completion of the inner and outer ring road systems to move traffic around central Stockholm. The key link in this system is the so-called "Western Highway" on the outer ring. Improvements to the inner ring include a new tunnel south of central Stockholm, the Södra Länken. Another long-term strategy is improvements to the rail system. About 500 trains come into central Stockholm daily on two tracks built in the 1870s. Plans are in place to build new tracks and a separate station for commuter rail, but they will not be completed until 2012.
Some politicians in Stockholm want a more immediate response to traffic congestion and its attendant environmental and safety issues. In 2002, the Green Party included public transport improvements and congestion pricing as part of its national policy agenda. A national law was passed mandating that congestion charges be implemented on a trial basis within 4 years. One unique aspect of the congestion pricing mandate is that it was imposed on the city and not conceived as a local solution as part of the conventional planning process. The objectives of the Stockholm Trial are to reduce congestion, maintain accessibility, and improve the environment. Key components of the Stockholm Trial are improved public transport services, a system of park-and-ride facilities, and a cordon congestion charging scheme in the form of a congestion tax. The total budget for the trial is more than US$500 million (SEK3.8 billion). The trial is a cooperative undertaking of the Swedish Road Administration (SRA) and the city of Stockholm and includes significant improvements to public transport in the region. More information on the pricing pilot is provided below.
As mentioned above, Stockholm is making improvements to its circumferential road system and rail network. The opening of the Södra Länken Tunnel south of Stockholm was accompanied by several key measures, including extra lanes at bottlenecks, an exclusive bus lane, intercept park-and-ride facilities, traffic management (ramp metering and signal timing) to maintain minimum speeds in the tunnel, cell and radio capabilities in the tunnel, road assistance services, video monitoring, and speed controls.
Public transport improvements include new tracks for commuter rail trains and a new commuter rail terminal near the existing central train station. New park-and-ride facilities are being built throughout the region, served by 16 new express bus lines using almost 200 new buses.
Sweden has developed a national strategy for traffic management using ITS, including five key priorities:
Sweden leads many countries of the world in road safety and has a Vision Zero policy aimed at eliminating road fatalities. One small measure in response to this policy was a speed limit reduction on residential streets from 50 to 30 kilometers per hour (km/h). Speed adapting systems are being placed in vehicles to alert drivers of unsafe speeds. One interesting question on the relationship between safety and demand concerned induced demand: When users perceive the system to be safer, do they actually travel more?
The Swedish ITS program includes a state-of-the-art traffic management center, speed and lane management, incident management, and roadside assistance. Examples of ITS measures, implemented as part of the new tunnel, are enumerated above.
SRA's Road Assistance program (akin to freeway service patrols in the United States) includes four assistance vehicles, two tow trucks, and even motorcycle units for use in space-restricted situations (such as tunnels). The drivers are trained emergency medical technicians and have lifesaving and firefighting equipment. SRA estimates that incidents cost Sweden US$33 million (SEK250 million) annually in lost productivity and activity because of delays.
Figure 17. Swedish Road Assist vehicle.
The Road Assistance program in the Stockholm area is directed by Trafik Stockholm, the regional traffic management center (TMC). Trafik Stockholm is a joint venture of the city of Stockholm and SRA (see figure 19). Trafik Stockholm operates an integrated system that provides the following:
Information sources include police, radio stations, SRA, city traffic monitoring data, and public transport operators. Information processed by the TMC is provided to travelers via traffic advisory radio, Internet, personal digital assistants (PDAs), variable message signs (VMS), invehicle systems, and the motorway control system using speed and lane control. Trafik Stockholm is empowered by Swedish law to change speeds or close lanes on the system (which in many cities requires police approval). The information is provided free to anyone to use or sell. Archived data are also used for traffic and transport planning purposes by the city and SRA.
Figure 18. Trafik Stockholm.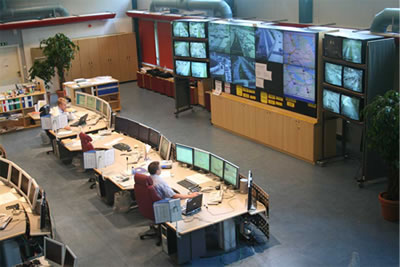
One outlet for road and public transport conditions is www.trafiken.nu, a Web site with a name that means "traffic now." The service is available in several of Sweden's largest cities and one tourist destination. Dynamic, real-time information is provided to users for pretrip decisions and the effort is part of Stockholm's CIVITAS project. Market research has shown that many users delay departure times (predominantly women) or change their travel mode (men) as a result of the information, and this research is testimony to Sweden's customer orientation.
Several complementary operational measures to the congestion pricing trial are being implemented as part of Stockholm's CIVITAS Trendsetter project, including bus priority schemes, traveler information delivery systems, and real-time bus arrival information at stops. Another operational measure is free onstreet parking for alternative-fuel automobiles.
A principal reason for visiting Stockholm as part of the scan was to learn more about the congestion pricing pilot project. The timing of the scan was fortuitous in that the "before" evaluation of the Stockholm Trial had been completed and the pricing pilot was scheduled to begin soon. Transit service improvements, including the new bus lines, were started in August 2005, new park-and-ride facilities were scheduled to open in the fall, and the congestion charge was set to begin in January 2006. While the national Parliament mandated the congestion charges in 2002, 2 years were required to pass local enabling legislation and resolve taxation issues associated with the charge (the charge is officially a national tax on the car owner). There were also delays in procuring the infrastructure for the vehicle identification and charging system.
The goal of the Stockholm Trial is to reduce traffic entering central Stockholm by 10 to 15 percent. A cordon has been established around the innermost islands of the archipelago with 18 charging points (figure 20). A charge of US$1.33 to US$2.66 (SEK10 to SEK20) will be imposed for each crossing of the cordon, depending on the time of day. The maximum charge will be US$8.00 (SEK60) per day. Crossings are estimated at 500,000 a day. At the end of each day, each traveler must make a "tax decision" and pay for the charges. Car owners have 5 days to pay before adjudication begins.
Figure 19. Map of pricing cordon around central Stockholm.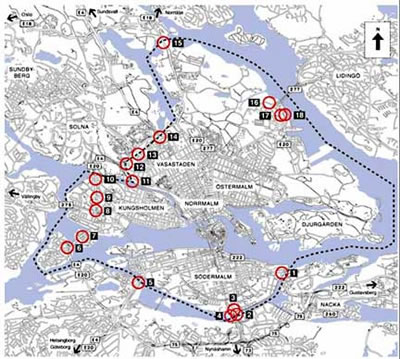
Estimated impacts include a 10 to 15 percent reduction in traffic into the city center (20 percent at cordon points) during peak periods, a 7 percent increase in public transport use (12,000 new riders, above current high levels), and an increase in traffic on the circumferential roads.
The technology used for the charging scheme involves both electronic identification using onboard units (OBU), or transponders, and automated number plate recognition (ANPR) photo systems that work independently. Only the photo system will be used as part of the payment and enforcement process (since a photo was deemed necessary for adjudication). Information on the Stockholm Trial is available at www.stockholmsforsoket.se.
Demand management is also being institutionalized into national and local transportation plans and programs. Mobility management (MM), defined in Sweden as "soft measures to influence travel before it starts," includes carpooling, working from home, information campaigns, travel planning, home delivery, etc. In the past 5 years, MM has been institutionalized in policy, planning, and programs. In the national Infrastructure Bill of 2001, SRA was mandated "to work with measures influencing the demand for transport towards a sustainable transport system, i.e., travel that is more effective, more environmentally sound and more safe than travel by car. . . . One such measure is Mobility Management." MM has been integrated into Sweden's local planning handbook and a standardized evaluation methodology has been created (System of the Evaluation of Mobility Projects, or SUMO). The national government is funding MM activities, partially with environmental funds, to operate mobility centers around Sweden, develop local MM projects, and create integrated, sustainable transport programs (described in the section on Lund).
One of the most significant examples of institutionalizing demand management in the transport planning process is the Swedish Four-Stage Principle, a new standardized approach for assessing highway needs adopted by SRA in 2002. The Four-Stage Principle requires planners and engineers to evaluate options in the following order:
Planners and engineers, therefore, are required to consider and rule out demand management and traffic management before they can consider improvements or new construction. This has created a new way of approaching and advancing transport projects at SRA that has resulted in application of alternative solutions rather than traditional capacity projects.
The Stockholm Trial and congestion tax will be a true test of the ability of the city, SRA, and public transport operator to implement a fully integrated package of incentives, services, and disincentives aimed at reducing peak-period car use-all to be tested in less than 1 year. The treatment of the congestion charge as a tax provides considerable challenges to both administering the pricing test and in user acceptance and public attitudes toward charging. However, the trial is being carefully evaluated and reports are provided monthly to policymakers and the public. An extensive before-and-after evaluation includes consideration of traffic flow impacts, public transport ridership, economic and air quality impacts, and travel times to measure the performance of the test in reducing congestion. A longitudinal survey with 36,000 respondents is underway to track behavior and attitude changes. The trial period will conclude at the end of July 2006 and results will be used to inform the public as part of a national referendum to be held on September 17, 2006. Information on the Stockholm Trial is available at www.stockholmsforsoket.se.
Staff members at the city of Stockholm and SRA believe that the primary unexpected lesson they learned from planning the Stockholm Trial is that they did not focus enough on the ultimate consumers, spending much of their time on fiscal and taxing issues and the technology of pricing. Public opinion is split, with almost one-third of residents thinking that the congestion charging scheme is a very good idea and an equal proportion thinking it is very bad. The fall 2006 election will provide the ultimate test in the form of a national satisfaction poll on congestion charging and its benefits.
Lund is a very old university town located in the southwest corner of Sweden, near the city of Mälmo in the Skåne region. This also places Lund near the new Öresund Bridge that links Sweden to Denmark. While the entire Öresund region of southern Sweden and Copenhagen has 3.5 million inhabitants, the city of Lund has 77,000 residents and the conurbation has 105,000. The University of Lund is one of Sweden's oldest with 34,000 undergraduates, 3,100 graduate students, and 5,300 employees. The university also boasts a teaching hospital and has spawned a technology center.
Some 25,000 commuters come into Lund each day and 35,000 change modes at the Lund rail station (figure 21). The current mode split for travel in Lund is about 45 percent automobile, 45 percent bicycling and walking, and 10 percent public transport. While many of the shortest trips are made by bicycle (over 50 percent of trips of 1.5 km or less), the car is still the predominant mode for many trips.
Figure 20. Bicycle parking at Lund rail station.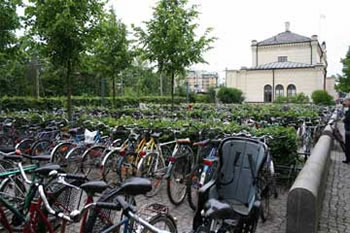
Town planning in Lund took a decided shift about 35 years ago to protect the historic core of the city by limiting automobile access and providing priority to bicyclists and pedestrians. In 1969, the municipal council decided against building a new southern arterial and in 1971 all nonauthorized traffic was banned from the city center to enhance the nonmotorized and public transport circulation and preserve the city's medieval core. This changed the course of town and transport planning, which has evolved into today's integrated sustainable transport initiatives. Sustainable transport planning in Lund does the following:
In the 1990s, after making significant commitments to reorient the city to nonmotorized modes, a major push was made to reduce the demand for car travel. The city set goals for traffic, including maintaining 1995 traffic levels through 2005, reducing per capita car use and city center traffic by 10 percent, and increasing bicycle use by 15 percent. The city also committed to a Vision Zero policy with reductions in road deaths and reductions in carbon dioxide emissions. Responses to the European Agenda 21 sustainable planning initiative and Lund's general plan update led to the development and adoption of LundaMaTs, Europe's first integrated sustainable transport plan.
LundaMaTs includes five key components (tied to the TOAST concept described in Chapter 1) to reduce car traffic growth and mitigate its negative effects:
LundaMaTs has involved more than SEK30 million (US$4 million) in funding from local, regional, and national sources. The specific projects and programs implemented under LundaMaTs and the resulting impacts are discussed below.
Figure 21. LundaMaTs schematic.
Lund has provided considerable infrastructure for nonautomobile modes. To promote bicycling as a primary mode, Lund has built a cycling network of 170 km of paths, including bicycle and pedestrian underpasses at key arterials. There are almost 5,000 bicycle parking spaces in the city center and 16 bike-and-ride facilities at bus stops. The train station includes a bicycle station called the Lundahoj. The bicycle station includes secure bicycle parking, repair, rental, and bicycle and traffic information from SRA. Staff from the Lundahoj also patrol the area to increase the security of bicycles parked around the train station.
One impetus for this physical enhancement was a city policy stating that "unprotected road users (bicyclists and pedestrians) shall have priority (over cars)." This has led to the reallocation of road space to these users and speed reductions. As a result of the "bicycle city" component of LundaMaTs, bicycle volumes have increased 1.25 percent a year since the 1990s.
Figure 22. Bicycle underpass in Lund.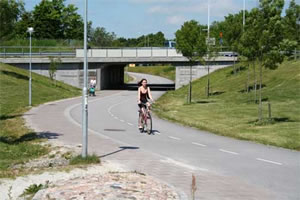
Finally, an environmental zone has been established around Lund to prohibit heavy-duty diesel trucks from entering the zone, in line with European regulations on older trucks larger than 3.5 metric tons in gross weight.
One measure to improve public transport and provide integration of local and regional systems is the bus rapid transit project called the Lundalänken, or Lund Link. The Lund Link connects the train station and city center with the university, hospital, and technology center. A direct connection is provided at the train station with real-time information displays of the next buses to depart. This high-frequency service uses a dedicated busway on much of the 10-km corridor, with many buses traveling on to residential areas. In places where buses are mixed with traffic (near the train station), priority is given to buses using signal preemption. Stations along the busway include shelters with real-time bus information. The Lund Link was opened in 2003 with the aim of improving the competitiveness of public transport.
The city has purchased land along the corridor at the end of the busway so that development can occur in a more transit-friendly manner. This is accompanied by decreased parking requirements and information on how living in the corridor can reduce the need for a second car.
As a result of the Lund Link, public transport ridership has increased by 20 percent in the corridor and about 120 new car parking spaces have been avoided.
Figure 23. Lund Link.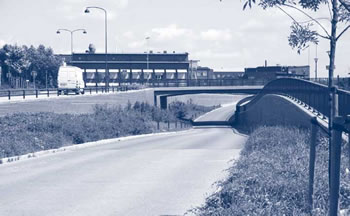
One unique aspect of the Lund Link and its integration with longer range planning involves how it is financed. In addition to funding from the region to initiate the service and build the busway, some revenue from the sale of land along the route is used to further develop public transport in the corridor.
To induce a mode switch to transit, those willing to try public transport for 1 year were provided with a significant financial incentive in the form of a free annual pass. These so-called "test riders" were recruited from outlying neighborhoods where transit was available, but driving was the predominant mode of travel. Mobility Center staff literally went door to door to provide personalized information on alternatives to the car, talking with 13,000 residents. The aim was to encourage, inform, and then induce trial use of public transport or bicycling. Some 340 test riders were recruited to try riding the bus. At the end of the free pass trial period, half continued to ride the bus. One year after the end of the trial period, over 40 percent continued to use public transport.
One of the most interesting aspects of LundaMaTs is the ability to institutionalize sustainable transport into the city's plans, programs, and policies. During the plan's development, elected officials were very active in crafting the programs and policies and providing vision. LundaMaTs implemented a variety of projects all at once, and this has clearly reoriented the way the city approaches transportation and land use decisions. Lund has just completed a new development guidance handbook that shows the impact of mobility management measures on traffic and the environment using data and experience gathered locally.
Lund's Mobility Center has been instrumental in educating residents, employers, visitors and others on the sustainable travel options available. Mobility Center staff members have worked to create "smart road users," "test riders," and "healthy bicyclists" by working with individuals and companies. While LundaMaTs includes measures to provide positive incentives and some with an element of compulsion, the emphasis is on encouraging voluntary changes aimed at creating an environmentally friendly transportation system.
Figure 24. Example of information from Lund.
A comprehensive evaluation of LundaMaTs reveals that after 2 years traffic levels (per capita car use) had decreased by 1 percent over baseline levels and after 4 years by 2.5 percent. This was accomplished by having close to 20 percent of all residents change their behavior in some fashion, such as by bicycling, using public transport, or making smarter choices about commuting and traveling into the city center, or trying to make changes when possible.
The next phase of LundaMaTs is now being planned to continue sustainable transport initiatives for 10 to 30 more years. The vision statement set forth by stakeholders is that a "transportation system in Lund be designed to meet what humans and the environment can bear." The evaluation will include traffic impacts, as well as social, economic, and environmental impacts. LundaMaTs will become more regional in scope to better address the growth in through trips.
Sustainable urban transport plans are now required of all large Swedish cities and this may become a European-wide requirement in the future.
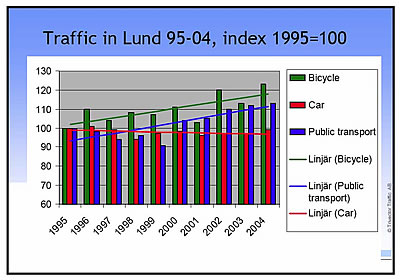
Lund has carefully monitored and evaluated the effectiveness of LundaMaTs to assess its ability to reach its intended goals. The amount of switching to sustainable modes resulted in an overall reduction in car traffic of over 2 percent in 4 years. This enabled Lund to meet its goal of maintaining traffic levels at 1995 levels. While Lund continues to grow, this growth is being directed in a sustainable manner. Thus, Lund may be one of the first cities to decouple traffic and economic growth.Illustration of man and bag of groceries on scooter.
Table 1. Traffic in Lund: 1995-2004.
Staff members from the municipality of Lund credit the integrated LundaMaTs project with increasing residents' knowledge about sustainable mobility. Information was provided that induced a change in travel behavior. Early involvement by politicians and careful evaluation has enabled the process to continue, resulting in a renewed plan for the next 30 years.
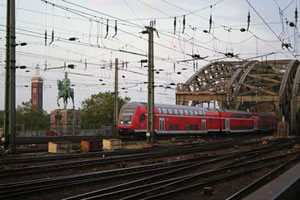
Cologne (Köln), situated on the Rhine River, is considered one of the major crossroads of Europe. At one time, Cologne was one of the most remote colonial (hence the name) cities in the Roman Empire. With a population of 1.1 million in the city of Cologne and more than 3 million in the region, more than 400,000 workers commute into Cologne each day from seven principal origin areas. Only four bridges cross the Rhine, and these carry 120,000 cars per day. Some 180,000 vehicles a day use the autobahn east of Cologne, which is part of a 52-km ring road system.
As such, the roads into and around Cologne are heavily congested. Of the 12,000 km of federal roads in the Cologne area, 2,000 or one-sixth are congested during much of the day. Today, there are significant pressures to expand the road system in an already very dense urban area and, indeed, lanes are being added to the ring highways to the west and east. But traffic management is a key part of the solution as well. Congestion costs billions of euros each year and the benefits of managing traffic not only include addressing congestion, but also reducing accidents and emissions.
Traffic control systems have been developed by the Federal Ministry of Transport, but traffic in and around Cologne is managed by both the city of Cologne and the State of North Rhine Westphalia. The state controls the highway system and the city controls arterials and the public transport system. In fact, 84 percent of the transportation budget in Cologne is spent on public transit, 15 percent on roads, and 1 percent on traffic management. The city estimates that it receives six times the benefits for each euro spent on its overall transport program.
Figure 25. Cologne, Germany.
Two major federal initiatives were partially responsible for leading the scan team to Cologne: an advanced traveler information pilot program called Stadtinfoköln, and the new federal road charging system for heavy trucks.
In addition to widening of the Cologne ring highways, the public transport system is being improved and expanded. The Kolnerverkehrsbetriebe (KVB) system, including trams, buses, and an underground system, carries 230 million riders per year. The KVB is in the middle of a US$1.25 billion (€1 billion) improvement program over 12 years to upgrade right-of-way, rolling stock, and stations and expand the system, notably the tram network. Improvements include the introduction of low-floor vehicles, prioritization schemes to increase speeds, an advanced schedule information system, dynamic information displays at platforms, and fare system integration.
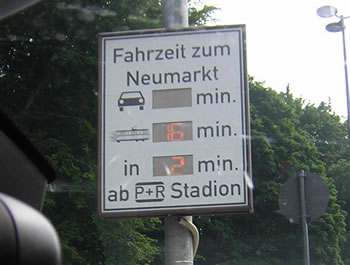
A park-and-ride system has been established along key arterials feeding into the city center where travelers can park and transfer to streetcars. There are five integrated park-and-ride facilities at tram stations, including 2,300 spaces. One innovative aspect of these facilities is the information system that provides drivers with real-time travel time comparisons. When approaching a park-and-ride lot and tram station, drivers can read a dynamic display panel, which shows the current travel time into the city center, the equivalent travel time by public transport, and how soon the next tram will arrive (see figure 27). This enables drivers to make informed choices about staying on the road or transferring to public transport. This travel time comparison initiative was integrated into the park-and-ride system as part of the Stadtinfoköln project discussed below.
Figure 26. Travel time comparison display on Cologne arterial.
The Federal Ministry of Transport developed several traffic control systems used in Cologne, including route control (managing traffic on existing segments), network control (distributing traffic on the entire system), and junction control (managing traffic onto or entering from one road to another).
The German route control system is similar to that used throughout northern Europe to harmonize flow on key segments. Overhead displays warn motorists about upcoming congestion and provide information on the source of the slowing (e.g., construction, incidents, weather, etc.). The data needed to manage a route include traffic volumes for cars and trucks, speeds, and weather. The relationship of the volume and speed of cars to the volume and speed of trucks is used to manage traffic, and historic data are used to predict conditions over the next 30 minutes.
Information is coordinated by regional traffic management centers, like the one controlling the greater Cologne region and operated by North Rhine Westphalia (figure 28). Information is provided to the police and radio stations. Current and predicted conditions on key routes are also provided on a state Web site (www.autobahn.nrw.de) and are available in other forms, including invehicle and via personal electronics, to allow drivers to better choose the time they travel (see more information on Stadtinfoköln below).
Figure 27. North Rhine Westphalia Traffic Management Center display.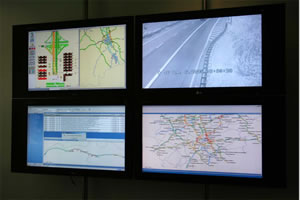
The ITS infrastructure installed to manage the system around Cologne was prompted by a massive accident caused by fog on the A4 autobahn between Aachen, to the west, and Cologne. These control systems cost between US$125,000 and US$375,000 (€100,000 and €300,000) per kilometer of highway, and segments are prioritized for this treatment based on the volume of accidents, traffic, and available funds. The route control system has reduced accidents and enhanced traffic flow to provide more efficient use of the road system. Some 900 km of the national autobahn system have route control for traffic management in this region.
One unique measure used in northern Europe is the Radio Data System-Traffic Message Channel (RDS-TMC) used by many radio stations on a periodic or episodic basis. When an alert on nearby congestion or an incident is broadcast, the motorist's car radio increases in volume or interrupts a compact disk and provides information on the location and duration of the congestion or incident. The information is provided by public traffic information services to public and private radio networks free of charge. Moreover, the same data are used in onboard navigation systems to provide dynamic route guidance so drivers can avoid congested roads.
Network control aims to move motorists around major backups or incidents by either providing information on alternative routes (additive approach of adding information on directional signs on alternatives) or rerouting traffic by changing destination signs (substitutive approach of integrating VMS into regular highway signage). The additive approach offers drivers a choice of travel route and the substitutive approach, in essence, makes the decision for drivers. An agreement between North Rhine Westphalia and the Netherlands (called CENTRICO) also manages traffic between Cologne and Eindhoven to reroute traffic under certain conditions.
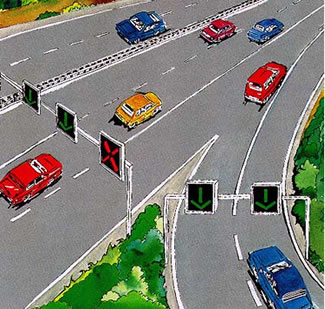
Junction control includes both ramp metering to manage flow onto highways and lane controls to close the main lane nearest the on-ramp to ease flow onto the highway (figure 29). Germany is also experimenting with the temporary use of the hard shoulder (currently only under the control of police) and photo enforcement of speeds on the autobahn (see more about this in the sections covering the Netherlands and the United Kingdom).
Figure 28. Junction control scheme on German autobahn system.
The city of Cologne is also extensively involved in traffic management for travelers once they are off the highway system or using alternative modes. In fact, the city of Cologne has a Traffic Management Department. In addition to road construction and maintenance, traffic management in Cologne relies on the following:
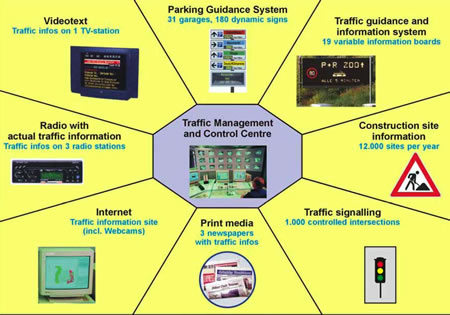
Traffic management in Cologne involves both a collective system involving traffic, parking, and park-and-ride management systems and an individual system providing information to travelers through dynamic navigation and other personal and invehicle devices. Information from Cologne's traffic management system is used for variable message signs, video text on TV, TV and radio reporting, newspapers, the Internet, information kiosks, invehicle systems, cell phones, and the parking management system.
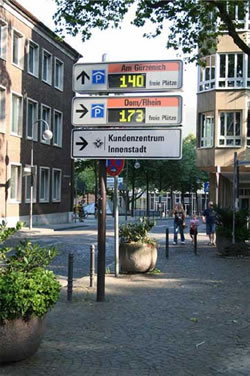
Cologne's dynamic parking management system helps efficiently move cars off the streets into 37 parking structures containing 22,000 spaces. Drivers are directed to one of four major parking zones by dynamic display signs that show the available number of spaces in that area using real-time information (figure 30). Some 23 VARIO variable message signs are also used to provide additional information on special events, current conditions, incidents, advisories to switch to public transport, etc. An evaluation in 2000 estimated that the parking management system reduced 9.4 million km of travel by cars searching for parking and reduced traffic by 3.2 percent in the city center.
Figure 29. Parking information display in Cologne.
Innovations in parking management are discussed below, but the integration of parking and traffic management is being realized for large-scale events, such as those at the new soccer stadium being built for the 2006 World Cup. Traffic coming to the new Sportpark Mungersdorf will be presorted on the highway system to route cars to available parking lots and parking shuttle systems. An even more dramatic example of parking management was the closure of highways, including a 13-kilometer segment of the A1 autobahn used to park buses during the World Youth Day event in August 2005 that brought 1 million pilgrims to the Cologne region.
While in Cologne, the scan team learned about the national truck tolling scheme. Germany's central European location, coupled with its extensive national highway (autobahn) network, results in significant goods movement by trucks passing through the country. In response to a mandate from the European Parliament and enabling legislation from the German Parliament, the Federal Office for Goods Transport (Bundesamt fur Guterverkehr) and the firm Toll Collect GmbH developed and implemented a distance-based truck toll system for German highways in a public-private partnership. Several other central European countries have new tolls for trucks, but the size of Germany's highway network and truck volumes presented unique challenges to not impede traffic flow. Germany adopted the truck tolls to have trucks pay part of the cost of maintaining the highway system, which has been greatly impacted by increases in truck travel, especially since the inclusion of Eastern European countries in the EU.
All heavy commercial vehicles of 12 metric tons or more used for moving goods are required to pay a distance-based toll to use the German highway system. The system is operated by Toll Collect GmbH. Truck operators have three ways to pay the toll: 1) automatically with an onboard unit (OBU) working with GPS, cell phone, and short-range communications technology, 2) manually at one of 3,500 toll station terminals (figure 31), or 3) on the Internet.
Figure 30. German toll payment station.
More than 80 percent of tolls are paid using OBUs, with one-third of the units installed on foreign trucks. Some 300 control bridges over the highway collect data from OBUs and take photos for ANPR enforcement. OBUs can pinpoint the location and direction of a given truck on any of 5,200 route segments on 24,000 km of German highways.
For trucks not exhibiting a valid registration and payment, some 280 mobile enforcement vehicles from the Federal Office for Goods Transport are used. The system experienced delays in getting started because of technical glitches with OBU performance in heavy-duty vehicles. Toll Collect GmbH, in operation since the beginning of 2005, and the Federal Office for Goods Transport had checked (by all tracking and enforcement means) 13.1 million trucks by the end of September 2005, with a violation rate below 3 percent.
A federal pilot program entitled Stadtinfokoln was initiated in 1999 to provide better information on traffic and traveler choices to individuals. While collective management systems controlled traffic and parking, traveler information tended to be mode specific and not well integrated. A system was created that feeds needed data into the Cologne traffic management center to manage the system and to a new system to provide real-time information to individuals in a coordinated fashion.
The pilot was one of five projects funded in Germany as part of a "Mobility in Urban Areas" program, including projects in Frankfurt (WayFlow), Stuttgart (Mobilist), Munich (MOBINET), and Dresden (Intermobil). Stadtinfokoln was intended to build a comprehensive, user-friendly traffic and transport information system (see figure 32). The project cost US$20 million (€16.3), half paid for by the federal program. The funding was strictly for research and the creation of the information system and included no funding for ITS infrastructure.
Figure 31. Traveler information in Cologne.
Innovative products resulting from Stadtinfokoln include the following:
All in all, Stadtinfokoln has succeeded in integrating existing information systems and created new services. But most important, it has improved the variety of user interface, supported multimodal choices, and developed predicted conditions and travel times while keeping the consumer in mind. The greatest barriers to the development and adoption of these information services tended to be more institutional than technical.
The German traffic management systems the team observed in Cologne are grounded in performance measurement to assure optimal operation of the transport system given the severely congested conditions. For example, the algorithm to lower speeds on the region's highway system is based on the mix and speeds of cars and trucks to assure safe conditions. Information on road conditions and parking availability are monitored all along the traveler's path to provide real-time information and advice on traffic conditions on regional roads, availability of park-and-ride lots, city traffic conditions, and parking lots in the center.
By introducing a comprehensive set of highway, road, and parking management schemes; improving public transport; and implementing advanced traveler information systems, Cologne has achieved an almost 10 percent reduction in peak-period traffic into the city center at a time when traffic on regional highways has increased by 18.5 percent. This is partially a result of a 25 percent increase in public transport use. However, mode, route, and time choices have enabled travelers to make smarter decisions about when, where, how, and whether to travel into Cologne.
The Netherlands is a very densely populated country that sees itself somewhere between a city-state and a country. It has 16 million inhabitants, with almost half living in the Randstad, or core, region bounded by Amsterdam, Rotterdam, The Hague, and Utrecht.
Figure 32. View of Rotterdam.
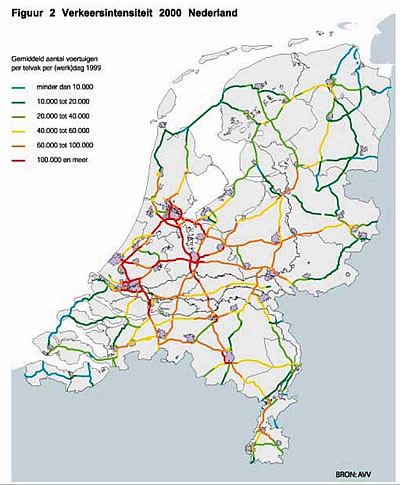
This area is highly congested, compounded by growth in truck traffic from the Port of Rotterdam, the world's busiest port. The national road system includes 3,200 km of highways, 2,300 km of which are high-speed facilities and more than 1,800 km of which have traffic monitoring (figure 34). In 2004, the Dutch reported more than 36,000 traffic jams on this system, with delay increasing 12 percent over the previous year.
Figure 33. Map of Dutch road network.
Dutch national transport policy has evolved over the past 10 to 15 years and new policies are in the works. The Second Transport Structure Scheme (SVV2), adopted in the early 1990s, set forth quantifiable targets for the environment, safety, and accessibility. To achieve these targets, the growth in automobile use was to be halved, from a projected growth of 70 percent by 2010 to 35 percent. To do this, the Dutch employed both "push" measures to make the automobile less attractive for certain trips (through pricing, parking management, etc.) and "pull" measures to make alternatives to the private car more attractive (including public transport, bicycling, and ridesharing). While the Dutch made great strides in refocusing projects and local policies on more sustainable transport options, a midterm review of the plan concluded that it would not achieve its goals. More conservative policymakers called for short-term capacity enhancements to help move cars and people.
The new Dutch Mobility Policy Document (Nota Mobiliteit), now being debated, recognizes that mobility is part of modern society, but proposes that the user of the transport system should pay the full cost of this privilege. Components of the proposed policy include 1) better use of existing infrastructure and improvements to alternatives for the car, 2) capacity enhancements where bottlenecks occur, and 3) a pricing policy that would replace fixed user costs with variable charges tied to use of the system. More information on the emerging national policy is provided below.
Some of the innovative measures undertaken over the past 10 years include advancements in traffic management, the introduction of mobility management, and a better understanding of the linkages among land use, car use, and accessibility.
However, another shift in the past 10 years is the decentralization of planning and implementation. Provincial and municipal governments and new public-private partnerships now have much more control on how transport issues are solved in the Netherlands. The VERDI expertise platform has been established to provide expertise and know-how possessed by the central government. The national government sees its role as developing new measures, testing their effectiveness, and providing guidance and technical assistance on local applications. The scan team's host in the Netherlands was the AVV Transport Research Center (Adviesdienst Verkeer en Vervoer) of the Rijkswaterstaat (RWS), part of the Ministry of Transport, Public Works, and Water Management, comparable to the U.S. Department of Transportation's (USDOT) Volpe National Transportation Systems Center. AVV provides much of the research and development work to address traffic congestion and seek new and enhanced solution strategies.
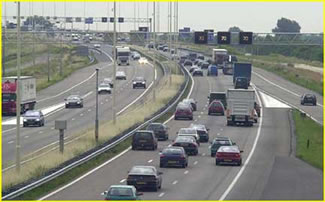
In a move to provide capacity enhancements to address growing demands on the road system, the Dutch have employed several efficiency improvements on their national highway system. This includes rush hour lanes (use of the hard shoulder with slower speeds during peak periods, as shown in figure 35), plus lanes (narrower lanes on the left using lower maximum speeds than other lanes, as shown in figure 36), a reversible tidal-flow lane (a separated median lane that operates in the peak direction), an exclusive bus lane near Schipol Airport, and exclusive truck lanes near Rotterdam. The Netherlands has less than 100 km of these facilities, implemented in the most congested corridors, with another 460 km planned (which will then comprise one-quarter of the monitored road network).
Figure 34. Rush hour lane.
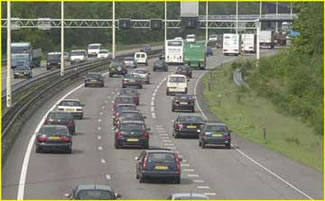
Figure 35. Plus lane.
The Dutch dynamic traffic management system, which allows for speed control and information on most main highway segments, enables special lanes to be operated while minimizing safety concerns. Since the introduction of rush hour and plus lanes, no fatal accidents have occurred on these segments. Again, one impetus for these efficiency improvements is political pressure to address capacity issues (that lanes are being added), even at the cost of lower speed limits. However, the potential environmental consequences of these measures, to increase speed by making operational improvements or adding temporary capacity, are also being debated in the Netherlands.
The Dutch have been innovators in highway operations to improve efficiency, a set of measures they call "dynamic traffic management" (DTM). The goals for traffic management include enabling transport growth while maintaining reliable and predictable door-to-door accessibility.
The Dutch conceptual framework provided in Chapter 1 (figure 6) shows how mode choice can affect transport demand, how route choice can affect traffic demand, and how lane choice can affect capacity efficiency. This leads to two basic management strategies: demand management and traffic management. Demand management includes pricing, information, and dedicated lanes for bus or HOV. Traffic management includes highway control systems, incident management, and intelligent vehicle applications. Traffic management (control) and demand management (information) are coordinated at traffic management centers.
Specific strategies include the following:
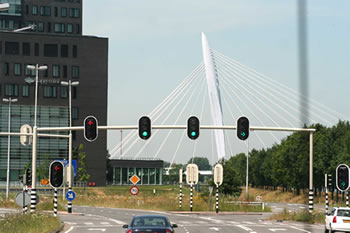
Motorway signaling involves overhead displays showing speed limits that can be changed to slow traffic during congested periods and when approaching incidents (figure 37). The system was first deployed in 1981. The Dutch road network has about 1,000 km of signaling, mostly in the dense Randstad area in the south of the Netherlands. AVV research has shown that motorway signaling improves vehicle throughput by 4 to 5 percent and has reduced primary and secondary accidents significantly.
Figure 36. Overhead motorway traffic management system.
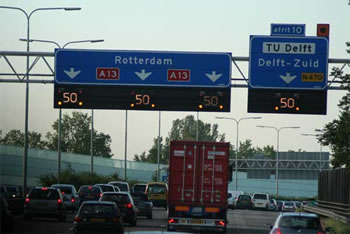
More recently, the Dutch have implemented dynamic speed enforcement using ANPR systems to maintain an 80 km/h limit on a section of motorway (figure 38). License plates are read entering and exiting the enforcement zone, speed is calculated, and violators are automatically notified. This has resulted in 50 percent fewer incidents, 15 to 20 percent reductions in nitrogen oxides (NOx), 25 to 30 percent reductions in particulate matter (PM10), and reductions in noise affecting adjacent neighborhoods.
Figure 37. Photo enforcement of highway speeds.
Ramp metering helps regulate the flow on highways and has led to measured speed increases and allowed capacity increases of up to 5 percent. Since 1989, 44 access points have been metered with another 16 planned. The Dutch learned about ramp metering from observing U.S. installations.
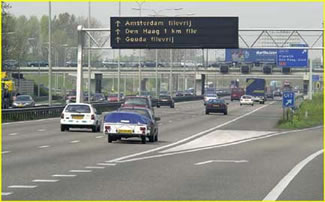
While signaling and ramp metering improve system efficiency, they do not really offer travelers choices. Demand management can be affected by on-trip and pretrip information. On-trip information is provided by a variety of mechanisms, including radio, invehicle navigation, and dynamic route information panels (DRIP), which are similar to variable message signs (VMS). These DRIPs are generally located over motorways and can provide information on queuing and travel time changes due to congestion (figure 39). About 100 DRIPs have been installed on the Dutch network since 1990. The Dutch road network, like the German network, often allows for alternative routing to be suggested. Therefore, DRIPs are sometimes used to show the travel time to a major destination via two alternative routings to help with driver choices. Research suggests that 8 to 10 percent of drivers react to the information provided on the DRIPs, which may lead to a 0 to 5 percent improvement in network performance. AVV's Test Center is experimenting with new means for displaying information on road conditions and even with flexible lanes with dynamic lane markings to accommodate rush hour lanes.
Figure 38. Dynamic route information panel.
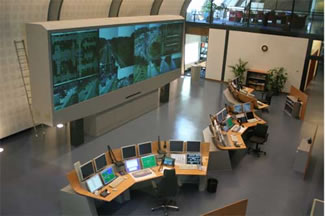
The Dutch highway system is managed from five traffic management centers, with the National Traffic and Information Management Center in Utrecht responsible for national coordination. Early in their existence, the role of TMCs was traffic control, which evolved into regional traffic management and, ultimately, network management. The current focus is managing the new network of rush hour lanes and providing quality information to travelers and various information providers (radio, auto club, etc.). The Utrecht center (figure 40) is organized to perform both network monitoring and control on a regional scale and to serve as a conduit for information distribution on a national scale. In fact, the center is organized with regional traffic management on one side of the building, information management on the other, with a meeting room in between for the national coordination of major events.
Figure 39. Utrecht Traffic Management Center.
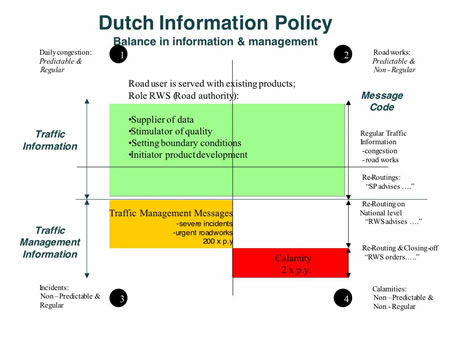
An information policy has been developed to guide the balance between simply providing travelers with information and managing the system. Traffic conditions and travel choices are provided to travelers in cases of predictable, recurring congestion and as part of road reconstruction activities. However, when nonrecurring incidents and major calamities occur, the information policy dictates that the system be managed through advisories and even road closures or other means that do not involve user choices. Figure 41 provides a schematic to show the situations under which information and system management are employed.
Figure 40. Traffic information matrix.
But it is information, especially pretrip information, that helps travelers choose which mode, time, and route is best for them. Traffic information is collected on the road system and from transport providers and processed by the Information Management Center. Under the Dutch policy on decentralization and privatization, information distribution is performed by some 15 service providers, who can sell the information to the media or others. One new model for information service delivery is SWINGH (Samenwerken in Groot Haaglanden or Working Together in the Greater Hague Region), a consortium of government, business, public and private information sources, and transport service providers organized to provide real-time, multimodal information to travelers.
A survey of 150 commuters was conducted in the Netherlands on the use of travel information to make decisions related to traveling to or from work. Two out of every five commuters said they used "near-trip" information right before commuting. The most common source of information was teletext (43 percent) on television before commuting to work, radio during the trip (88 percent), and the Internet (85 percent) when traveling back home. Of those using near-trip information, 57 percent used it to determine the best route, 39 percent used it to leave earlier, 25 percent used it to leave later, 13 percent used it to decide to stay home and work, and only 3 percent used it to change mode to public transport or bicycling. On-trip information, used during car travel, was also explored. Almost 9 out of 10 (88 percent) use information provided on their car radios, 9 percent use cell phones for information, and 5 percent use dynamic route information panels (DRIPs) on the highways. Like most European countries, the Netherlands continuously broadcasts traffic information in RDS-TMC digital code on the national radio network, and this information can be presented and used by onboard navigation systems.
This AVV study provided interesting insights into future trends for traveler information. The study concluded that traveler information was going from collective to individual, static to dynamic, broadcast to interactive, and roadside to invehicle. It also reported that information is evolving from one mode (cars) to multimodal and from supply based (planned travel) to mobility based (how to travel).
The predominant type of information is changing as well, from the length of congestion (length of the queue) to travel time or delay. AVV has also developed a travel time prediction capability that uses historic traffic information to predict where, when, and how long delay will occur. This resulted in the development of a customized pretrip predictive tool that uses average travel times to predict a range of forecast travel times based on a given origin and destination, day of the week, and desired departure time. This system differs from the predictive tool developed in Cologne, Germany, that uses data from the last few hours (not historical) to project conditions for the next 30 to 60 minutes.
The Dutch travel time predictive tool is valuable for use with route-planning software, which calculates travel times on free-flow, uncongested conditions. The Dutch tool was developed for the Internet and tested on RWS employees, who were largely pleased with the information and ease of use. AVV officials believe that this tool could help level off the peak period by moving travelers to the shoulders of the peak with better information that results in more reliable travel times. Unfortunately, the private information service providers are not yet convinced that the information would be desirable or trusted by the public, so it has not yet been adopted in the Netherlands.
Like the Swedes, the Dutch differentiate between "mobility" and "accessibility," maintaining that residents should have access to activities, but should not be guaranteed a specific level of mobility to get there. "Paying for mobility" is a key policy element in the new Dutch Mobility Policy Document (Nota Mobiliteit) discussed below.
Congestion pricing was a key part of the new Dutch national transport policy (SVV2), but was not tested or implemented because of political concerns over user acceptance, as has been the case in the United States. The policy document concludes that road pricing is one method of paying for road use that is necessary to maintain reliable travel times while continuing economic growth. A "paying for mobility" platform has been established to recommend a program of testing and adopting new pricing measures. This will likely involve pilot projects during the first part of the new national transport plan and national deployment of one or more options in the second part. The platform is developing pilot projects, but it appears that cordon charges (like London, Stockholm, and Rome) will be tested and adopted first, followed by distance-based charges on the national network (also being contemplated for the United Kingdom). The Dutch are not developing road pricing to generate new revenue, but to restructure user charges away from excise taxes toward user charges that reflect the full social costs of mobility.
The Dutch have reoriented several policies and practices based on their extensive experience with transportation management, including demand management and dynamic traffic management. First, they are revising the planning process to include sustainable travel. They are also reorienting mobility management and institutionalizing integrated, coordinated traffic management.
The national government, in its role to assist lower levels of government, has developed many tools based on its experience with traffic management. This includes the Handbook on Sustainable Traffic Management, which outlines a stakeholder process for planning traffic management strategies for a given region or situation. It allows for an integrated set of measures to be developed, from localized strategies to network management techniques. As with the national mobility policy, the objective of sustainable traffic management is travel time reliability, which will help with overall network performance. The sustainable traffic management approach enumerates 12 steps from stakeholder involvement to implementation and operation, as shown in figure 42. The process has been used in about 50 locations since its introduction in 2002 and is being integrated into national highway planning processes. Planners, engineers, consultants, and others have been trained in the process, which basically prioritizes facilities and actions based on a consensus of needs and problems.
Figure 41. Sustainable traffic management process.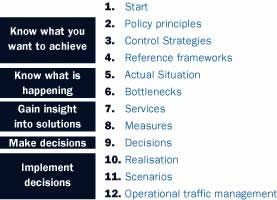
Another means of managing demand that has evolved considerably in the Netherlands is mobility management (MM). The Dutch view MM as getting (or even seducing) people to make smarter travel choices by organizing and promoting alternative options. In the 1990s, the Dutch examined U.S. experience with transportation demand management (TDM) and the RWS undertook several pilot programs, including carpool matching, vanpooling, employer TDM programs, transportation management associations, and others. Under SVV2, goals for mode shift were established, but not realized on a widespread basis. Decentralization of transport in the Netherlands led to a different role for central government, that of setting the policy framework, transferring knowledge from its experience, facilitating innovation, and monitoring results. The implementation of MM measures is now in the hands of the provinces, municipalities, and their public and private partners. This has turned MM upside down, shifting the emphasis from government trying to manage commuter travel to new partnerships to assure accessibility to key locations that are "mobility generators." The new Mobility Policy Document establishes new roles for MM, including requirements for environmental clearances and large-scale events.
One example of this is the "accessibility contract" negotiated between public and private interests in the Bezuidenhout employment center near The Hague. Regional, local, and business interests developed a covenant to reduce single-occupant car use to the center. The region provided a new bus service from a nearby rail station in exchange for major employers' commitments to induce their employees to use public transport, carpooling, and bicycling. The agreement resulted in a 6 percent reduction in car use to the center and has served as a model for such a quid pro quo agreement. These accessibility contracts evolved from the more unilateral approach called the A-B-C Location Policy, in which new developments near rail stations could not build employee parking to induce public transport use by future tenants.
Mobility management has also been effective during highway reconstruction projects. During the reconstruction of the A10 West near Amsterdam, several mitigation measures were introduced for commuters into the area. Measures implemented included park-and-ride enhancements, shuttles, individualized travel advice services, flex time, telecommuting, and free public transport tickets. Combined transport and event tickets have also been used in the Netherlands for sporting events, such as soccer matches and the Rotterdam Marathon.
An extensive evaluation of the A10 reconstruction mitigation scheme revealed that many commuters changed their arrival and departure times, telecommuted, and bicycled to work. Car use decreased by 5 to 10 percent during the reconstruction period, but car use increased on adjacent arterials, leading to negative impacts in some neighborhoods. Lessons learned from this experience are being applied to reconstruction mitigation on the nearby A9 and a new type of travel pass is being developed to allow use of any public transport service in the area.
The Dutch are also rethinking the way they measure system performance. The new Mobility Policy Document (Nota Mobiliteit), being considered by Parliament, aims to link spatial planning with transport policy and environmental protection. It sets a common framework for the continued decentralization to the provincial and local levels (figure 43).
One interesting aspect includes the way mobility on the nation's road system will be measured. The performance measurement system involves travel time reliability and predictability. An average door-to-door travel time is being developed for a hypothetical 10-km trip in each part of the country and is being based on perceived travel times developed from the annual Dutch Travel Survey. The performance measure is then assessed as the ratio of the peak-hour travel time to the free-flow travel time. The proposed policy calls for 95 percent of all road trips to be on time. According to the policy, on time during the peak hour would be only 1.5 times that of uncongested times nationally and not more than 2.0 times in urban areas. This travel time reliability will be monitored and reported to key stakeholders, including Parliament.
Figure 42. Nota Mobiliteit pyramid.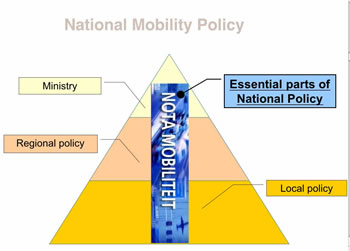
The Dutch approach to managing demand has evolved to more dynamic traffic management to achieve reliable travel times. The Netherlands' extensive research and experience in traffic management, mobility management, and accessibility have served all levels of government and industry during the movement toward decentralization and informed new national policy now being adopted. However, decentralization and new public-private partnerships occasionally have led to the slower adoption of innovation, as is the case with the travel time prediction software developed by AVV.
A visit to the United Kingdom provided the scan team with the dual benefits of observing the well-publicized Congestion Charging Scheme in London and learning about other methods for managing congestion and demand throughout the country.
Road traffic has grown by 79 percent since 1980, but this growth slowed in the 1990s. As such, the United Kingdom has been able to show a decoupling between transport growth and economic growth. Using "traffic intensity" (total vehicle miles driven divided by GDP) as an indicator, travel has been growing at a lower rate than economic growth. Since 1992, while GDP has grown by 36 percent, road traffic has grown by only 19 percent. Road users view congestion as a more serious problem in cities and towns than on motorways. In fact, average speeds in Greater London are 24 km/h (15 mi/h) and below during peak periods and only 32 km/h (20 mi/h) during offpeak periods.
Figure 43. Greater London.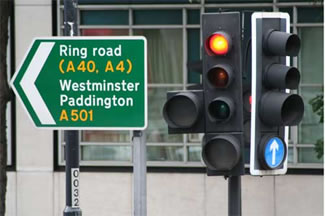
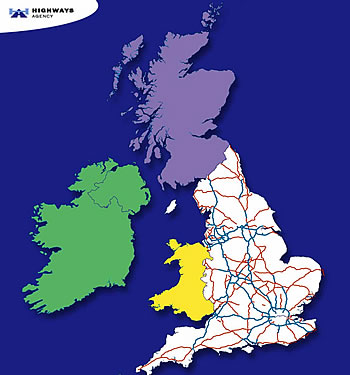
The national road network in England includes 7,754 km (4,818 mi) of motorways (freeways) and trunk roads (figure 45). Two-thirds of the congestion on this network is recurring and is caused by increased volumes. This network is managed by the Highways Agency (HA), an executive agency of the Department for Transport (DfT). In London, Transport for London (TfL) manages traffic, administers the Congestion Charging Scheme, and oversees public transport, including London's extensive underground and bus networks. Greater London is Europe's largest urban area with more than 7 million inhabitants and employment of 1 million in Central London.
Figure 44. British national road network.
At the national level, the Department for Transport and the Highways Agency are developing plans and programs to better manage traffic and influence travel behavior by inducing travelers to make smarter choices. The motto of the Highways Agency is "safe roads, reliable journeys, informed travelers." This includes a major emphasis on treating road users as customers. In London, commitments to "do something about traffic" led the mayor to impose the Congestion Charging Scheme and make significant improvements to bus service into and within London.
Two road improvements intended to give priority to higher occupancy vehicles carrying more travelers are the bus lane to Heathrow Airport and the planned carpool lane on the M1 to Luton. The 5.6-km (3.5-mi) bus lane on the M4 to Heathrow was opened in 1999 at a cost of £1.9 million (about US$3 million) and is available to buses and taxis (figure 46). An evaluation of the bus lane showed that it reduced travel times for bus users by 3.5 minutes and rush hour travel times for all car users by 1 minute and that travel times had become more reliable for all users.
Figure 45. M4 bus lane.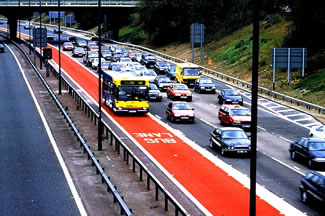
In fall 2005, the Highways Agency was scheduled to begin construction of an HOV lane on the M1 between St. Albans and Luton (Junctions 7 to 10). This location was selected over four other sites near Manchester, Leeds, and London. This 2+ carpool lane (for vehicles with two or more occupants) will be completed in 2008 and will be accompanied by complementary strategies to market the facility and allow for park-and-ride opportunities. A comprehensive before-and-after evaluation is underway to assess impacts on traffic flow, travel times, vehicle occupancy, accidents, and driver attitudes.
The British have employed several operational measures to improve the efficiency of the existing network and manage demand at large traffic generators, including Heathrow Airport and the site of the British Grand Prix.
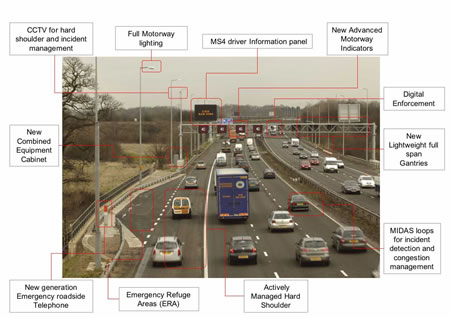
The Highways Agency has developed an active traffic management (ATM) system, similar to the Dutch concept of dynamic traffic management, and is implementing it on a 16-km (10-mi) stretch of the M42 east of Birmingham in the West Midlands (figure 47). While Britain has used changeable speed control signs since 1964 and has been monitoring speeds and detecting incidents with its motorway incident detection and automatic signaling (MIDAS) system, closed-circuit cameras, and Trafficmaster™ APNR systems for many years, the M42 combines these with new measures. These innovations include use of the hard shoulder, as is done in the Netherlands, and new rapid response incident management practices borrowed from the United States. The purpose of the ATM pilot is to make travel times more reliable and reduce congestion by giving drivers more and better information and responding to incidents more quickly. Finally, the ATM system will also include automated enforcement of the posted speed limit using ANPR. This photo enforcement on a high speed facility is used elsewhere in the United Kingdom, including the enforcement of a 64-km/h (40-mi/h) limit on the M25 near Heathrow and the M4 in Somerset during a major reconstruction project. The pilot ATM system will also rely on Highways Agency traffic officers, who have the power to stop traffic, close roads, direct traffic, and enforce laws. Experience has shown the many benefits of ATM, including improved travel times, fewer accidents, reduced idling and emissions, improved speed compliance, and favorable driver reactions.
Figure 46. M42 with active traffic management.
The British also use historical data on travel speeds and delay (journey time database) to predict travel times for all links in the road network for 21 types of days (e.g., Mondays during the school year). This information is available to travelers on the Highways Agency information Web site (www.trafficengland.com). In addition, the Department for Transport has a multimodal Web site (www.transportdirect.info) with a trip planner that uses congested travel times.
One example of managing demand to a major employment center is the Surface Access Strategy for Heathrow Airport, which is based on an effective partnership to effect mode shifting. Heathrow Airport is operated by the British Airports Authority, a private entity, and employs 68,000 workers at 435 companies at or near the airport. About 175,000 air passengers travel to Heathrow daily. In 1994, when a new express rail service (Heathrow Express) was being planned, the Heathrow Area Transport Forum was formed to create modal shifts to more sustainable modes than the private car. At that time, the drive-alone share of workers was 78 percent, and bus and carpool shares had decreased since 1975.
The Surface Access Strategy includes the following:
Figure 47. Heathrow Fast bus.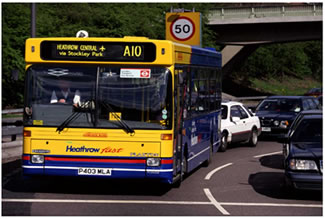
The strategy is funded by an airport surcharge on parking (passenger and employee) that raises about US$3.6 million (£2 million) per year. The strategy has resulted in several new and improved commute alternatives, including new bus routes, a fare-free zone within the airport area, an employee bus pass that can be used on any service, a carpool matching program, and improved traveler information, including an Intranet travel planner. Careful evaluation has shown that the drive-alone share has dropped to under 70 percent, while the bus share has doubled to 12 percent and carpooling has increased by 50 percent to 6.75 percent, as shown in table 2. The future of the strategy may be in express bus services and carpool initiatives to continue meeting targets in reduced car use. The success of the strategy has been attributed, among other things, to effective partnerships and marketing of the commute alternatives.
Table 2. Heathrow employee modal split.
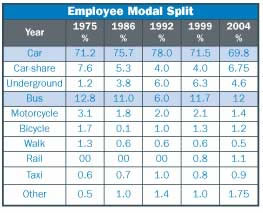
The Highways Agency has also developed traffic management schemes for major events and highway reconstruction. The British Grand Prix at Silverstone in Northamptonshire is an event that taxes the highway system for several days. While 100,000 fans attend the Sunday race, more and more fans attend on Friday. This has a tremendous impact on the A43, which normally carries fewer than 40,000 vehicles per day. To help three types of customers-race attendees, local residents and commuters, and long-distance through travelers-HA partners with several agencies and private interests to implement a traffic management scheme for the race, which necessitates the closure of the A43 to nonrace traffic (figure 49). Diversion routes have been designated and a massive information campaign developed to inform all three types of customers of their options. While the primary choice involved in this example is route choice, the Silverstone experience shows that advanced coordination and information can lead to significant behavior change in response to a major planned event.
Figure 48. A43 closure sign during British Grand Prix.
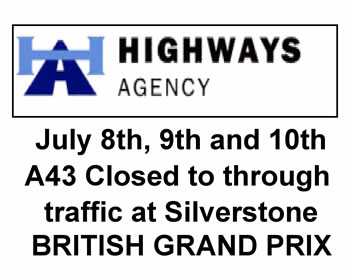
The reconstruction and widening of the M25 near Heathrow's new Terminal 5 has included public information campaigns (including outreach to France), ANPR enforcement of a 64-km/h (40-mi/h) speed limit through the construction zone, and vehicle recovery response teams to remove vehicles and reduce incidents. In this case, early evaluation results show that many travelers are changing mode or route to avoid this highly congested segment.
The Central London Congestion Charging Scheme was implemented in early 2003 and involves an area pricing program to charge vehicles in the center of London to accomplish the following:
It operates weekdays from 7 a.m. to 6:30 p.m. and involves a flat charge of more than US$14 (£8) per day (raised from US$9 (£5) in July 2005) for travel within the charging zone (see figure 50). Enforcement is by ANPR cameras that match vehicle registration to drivers, who must pay for entering the center by 10 p.m. Users can pay daily, weekly, monthly, or annually through the Internet, cell phone, call center, or retail outlets throughout London. Residents who live within the charging zone are eligible for a 90 percent fee reduction.
Figure 49. Map of London charging zone.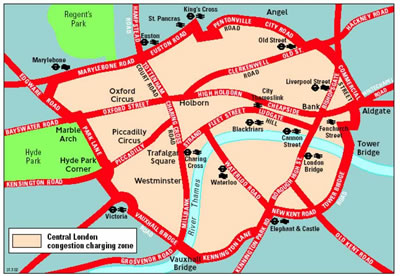
The net revenue generated from the charges, about US$180 million (£100 million) per year, is used to provide additional and improved bus service and for other transport strategies being implemented by Transport for London. As of the third monitoring report, congestion in the charging zone has been reduced by 30 percent by reducing the number of cars entering the zone by 18 percent. This has enhanced the reliability and speed of buses in central London. About 80 percent of all peak-period trips into central London are now made by public transport. The fact that mayor of London is responsible for both traffic and transit operations is a key factor in the success of the London pricing scheme. These functions are most often separate in the United States.
Figure 50. Charging zone sign.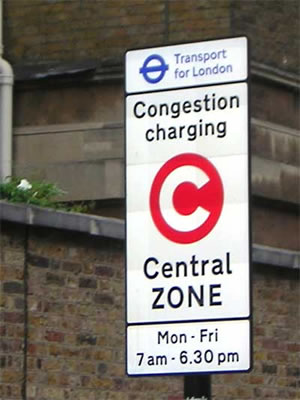
The mid-2005 increase in the fee from £5 to £8 per day cited above is expected to reduce congestion an additional 4 to 8 percent. There are plans to extend the charging zone into the West End, which is also heavily congested but still has good public transport service. While public support is mixed on the charging scheme and its expansion, it came about as part of a campaign promise by the mayor of London to "do something" about traffic. He was reelected in 2004 after implementing the charging scheme.
Based partially on the success of the London Congestion Charging Scheme, the government is exploring implementing a national road pricing scheme that would set a distance-based fee on car use. A feasibility study completed in July 2004 concluded that road pricing was feasible in about 10 years (the timing due partially to needed technology advances) and could meet the government's objectives of efficient pricing, fairness, inclusion, economic growth, and environmental benefits. A pilot program is being planned to test GPS technology for a mileage-based charging system. It is estimated that a national road pricing scheme could reduce urban congestion by half. Meanwhile, the United Kingdom plans to introduce truck road user charges, similar to the German system, which will help inform a nationwide application of pricing.
The U.K. government takes in US$72 billion (£40 billion) in transport taxes and spends US$9 billion to US$11 billion (£5 billion to £6 billion) on roads and related programs (since transport tax revenue is not hypothecated to transport uses as is the Highway Trust Fund in the United States), including a National Transportation Innovations Fund that rewards areas willing to try new solutions to congestion, accessibility, and mobility. The U.K. government is considering changing its entire scheme for taxing vehicles to national congestion charging, which is expected to generate an equal amount of revenue, but is also estimated to result in almost US$21 billion (£12 billion) per year in economic benefits compared to the current tax system.
The United Kingdom has growing experience in innovative institutional strategies to change travel behavior and monitor its effect on congestion. This includes integrated pilot projects and national initiatives to influence travel behavior.
The EU-funded CIVITAS Initiative includes two pilot sites in England, in Bristol and Winchester. CIVITAS seeks to integrate both hard technology and soft policy measures, like combining clean-fueled buses with individualized travel planning to increase public transport use. The CIVITAS pilots in the United Kingdom are partnerships among EU, national agencies (energy, transport, health, and redevelopment), local government, and business. In Bristol, the measures implemented included a taxi-sharing program in an area not well served by conventional transit, a freight consolidation center to reduce delivery trucks, an individualized travel campaign, a car-sharing service, a new information center, and an "information bus" (a mobile transit information center). Results are encouraging; for example, the freight consolidation scheme (in which various trucking services come to a central location outside the retail district and a single truck makes consolidated deliveries to each retailer) has reduced delivery vehicles by 65 percent in the Broadmead district. One benefit of the integrated set of programs is bringing diverse interests together to achieve common societal goals. In Winchester, the emphasis is on environmentally friendly measures, including parking fee discounts at a park-and-ride facility for cleaner cars and new clean buses serving the facility, access restrictions for high-polluting cars, a "bikeabout" program to increase bicycle use, and a Collectpoint parcel service that allows residents to pick up parcels at a nearby convenience store rather than receive deliveries at home (figure 52).
Figure 51. Winchester Collectpoint location.
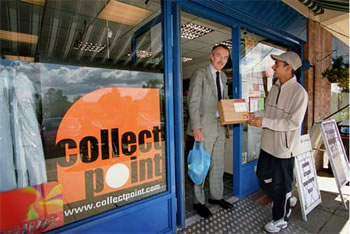
The Department for Transport (DfT) and the Highways Agency have developed concerted programs aimed at changing travel behavior. The DfT conducted a study, reported in Smarter Choices: Changing the Way We Travel, on the potential impacts of "soft" measures. The study concluded that these TDM measures, if implemented widely and intensely, could reduce peak-period urban traffic by as much as 14 to 21 percent and nationwide traffic by about 11 percent. A lower intensity scenario was developed as well.
This study led to a new national information campaign called "Making Smarter Choices Work." This campaign promotes "soft" measures: workplace travel planning (similar to employer trip reduction plans in the United States), school travel plans, personalized travel planning, public transport information and marketing, travel awareness campaigns, carpooling, car sharing, teleworking, teleconferencing, and home shopping. DfT has performed extensive research based on pilot programs and is committed to institutionalizing these measures. For example, the national government has provided funding so that local governments and schools can hire travel planners to help develop programs at workplaces and school sites. DfT is also funding three "sustainable travel towns" to integrate the components of the smarter choices campaign in a medium-sized city. The government's plans are ambitious. For example, it hopes to have a travel plan in place in every school in the nation by 2010. It is providing expertise and small capital grants to realize what it estimates would be an 8 to 15 percent reduction in traffic around schools. (See figure 53 for an example of a school travel initiative-the "walking bus").
Figure 52. "Walking bus" school travel initiative.
The Highways Agency has also developed a program called Influencing Travel Behavior to mainstream demand management measures into the agency's ongoing operations and plans. HA defines influencing travel behavior as "managing the demand for journeys within the capacity of the truck road and motorway network." This includes influencing the land development control process not only to consider road access, but also to consider means to reduce demand. It also involves HA in the workplace travel planning process at sites where employees rely on the national road network. In addition, tourism and leisure travel are being targeted so that travelers might seek information on alternatives during their holiday planning. As mentioned earlier, HA is also working to demonstrate HOV lanes and carpooling. A schematic showing all of the elements of the initiative on influencing travel behavior is shown in figure 54. While these activities all seem reasonable, the real story in HA is the institutionalization of demand management in the everyday workings of a highway agency and a commitment to consider demand-side strategies by forming new partnerships with local government and business.
Figure 53. Influencing travel behavior schematic.
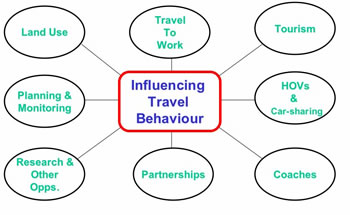
The way congestion management performance is measured in the United Kingdom is evolving. DfT has established a policy of congestion targets for the road system, based on the notion of accountability for public expenditures on the system. While the long-term strategy involves road pricing, interim targets have been set on achievable improvements, such as the new HA traffic officers and active traffic management. The principal performance measure is based on improved travel time reliability and is measured against the 90th percentile of travel times. In other words, the government seeks to see improvements in travel time reliability by reducing travel times for the worst 10 percent of congested trips. The national network has been divided into 98 key routes and the 90th percentile travel time calculated over a 1-year period. HA is charged with showing improvements in these travel times or it will lose highway investment funds in that area.
The United Kingdom provides evidence of government leadership in tackling traffic demand in almost every way possible. The London Congestion Charging Scheme was made possible by a courageous elected leader willing to use all means possible to manage demand. The British government is also deploying several other measures, including active traffic management and TDM, to assist travelers in making smarter choices on mode, route, time of travel, and even location.
| << Previous | Contents | Next >> |

