U.S. Department of Transportation
Federal Highway Administration
1200 New Jersey Avenue, SE
Washington, DC 20590
202-366-4000
Queensland, located in northeastern Australia, is two times the size of Texas and five times larger than Japan, but has only 3.7 million residents, most of whom are located in southeastern Queensland (mainly in Brisbane). Large parts of Queensland are rural and undeveloped, leading to active government provision of transport services (for example, the government has contracted for five long-distance intercity bus and two important air services that serve 48 remote communities) The heavy use of performance-based contracts for service delivery, as well as a long history of corporate strategic planning, were motivations for the scan team to visit Queensland.
Governmental Context
The Queensland government has set five priorities for its activities: provide safer and more supportive communities, create more jobs that focus on technical skills and innovation, enhance community engagement and quality of life, develop rural areas, and protect and create value in the natural environment. The Queensland parliamentary portfolio for transport has a defined vision statement that places transport squarely in the economic and quality-of-life future for the state. According to this vision statement, the transport portfolio will "contribute to government outcomes through consistent, coherent leadership in the development and management of innovative transport solutions for Queensland that connect people, goods, and services."
The transport portfolio includes two organizations—Main Roads and Transport Queensland. Main Roads owns and manages about 34,000 km (21,127 mi) of roads and is responsible for all aspects of planning, designing, constructing, operating, and maintaining this network. Queensland Transport is the lead agency for "developing and managing the land, air, and sea transport environment" in Queensland, and is responsible for vehicle and vessel registration and licensing. The government has also created government-owned corporations to provide passenger and freight rail services (Queensland Rail) and to manage ports and some airport facilities. Queensland Transport provides overall policy guidance for these efforts.
Use of Performance Indicators
Figure 9 shows the relationship among the different elements of the decision-making process in Queensland. The government's broad goals guide the development of transport policies. They, in turn, result in certain levels of transportation system performance, monitored through performance indicators, which then lead to interventions or actions by transportation agencies to enhance this performance. The scan team observed the relationship among these elements in the many planning documents and processes described during the scan team's visit. Performance indicators, which related closely to overall government policies for Queensland, were consistently presented in each of these documents and processes, and in many cases, provided the overall structure for the presentation of information to the reader or participant.
Several key documents provide overall guidance to the activities of Main Roads and Queensland Transport.
4 Seeable Futures—In 1999, both transport agencies initiated a transportation scenario planning exercise covering 2000-2005. The questions participants in this exercise faced were, "How will we be connecting people, goods, and services in 25 years, and what will that mean for transport?" The outcomes of this effort were intended to inform the strategic planning and policy making efforts in each agency. Although no performance measures were included in the document, nor in the process followed, the scenario analysis did provide boundaries on the magnitude of expected trends that would likely affect the performance of the transportation system.
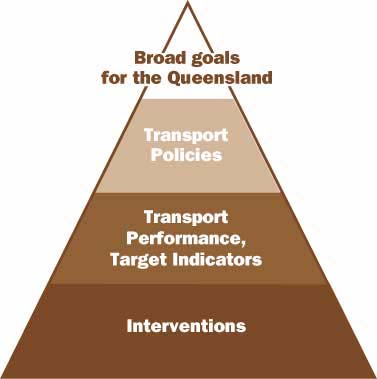
Figure 9. Relationship of performance indicators to agency decision-making in Queensland.
Roads Connecting Queenslanders—One of the most important documents for laying the groundwork for decision-making in Main Roads is a 15-year planning blueprint entitled Roads Connecting Queenslanders. This document provides overall direction in meeting the challenges the agency is likely to face in the future. Main Roads' officials stated that the document clearly indicated to agency staff that Main Roads had to move away from a focus on outputs to more emphasis on how outputs contribute to outcomes. The relationship between Main Roads' major outputs to the government's outcomes described in Roads Connecting Queenslandersis illustrated in table 5.
Figure 10 shows the strategic framework for road system asset management that is part of the overall planning framework represented by Roads Connecting Queenslanders. As noted in the plan, this framework illustrates a series of integrated steps that provide a logical progression of thinking about program delivery:
Roads Connecting Queenslandersoutlined broad categories for performance indicators, and stated that more definitive indicators would be developed in subsequent efforts. For example, in the "efficient and effective transport" category, Roads Connecting Queenslandersstates that indicators will be developed in the following areas: measures of freight efficiency, travel time on the state highway network by time periods, stakeholder feedback, and restrictions on commercial traffic due to natural causes (e.g., flooding).
Strategic plans—Government agencies are required to produce strategic plans that link their action plans to overall government policies. According to the strategic plan for Main Roads, "The Main Roads strategic plan is part of a tiered planning framework to enable successful performance management. There is now an integrated planning process with clear linkages to Roads Connecting Queenslanders, Strategic Plan, and all other business planning and policy development and clear accountabilities. The integrated planning framework requires business plans for each division within Main Roads to demonstrate their contribution to the Strategic Plan. The budgeting framework aligns with the high-level services and products within the Strategic Plan."
The strategic plan for Main Roads provides an extensive list of strategic issues, objectives, performance measures, strategies, and deliverables, and an implementation time line. The performance measures as they relate to specific objectives are shown in
Table 6. The strategic plan for Queensland Transport also includes a long list of objectives and corresponding performance measures.
| "[Moving to a performance orientation] has involved a cultural shift in the way the department operates. It has meant moving from collecting data as audit material, to collecting data as part of a conscious plan to improve performance." —Main Roads official |
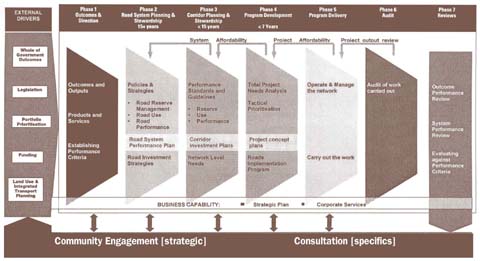
Figure 10. Strategic framework for road system asset management in Queensland.
Road Implementation Program—The Road Implementation Program is a five-year program that includes the priorities and policy choices that Main Roads will implement for the first two years, and "indicative funding and intentions" for the three years that follow. By law, the program must include the policies, financial provisions, and performance targets that guide agency decisions. It also provides accountability for the previous year's performance by reporting on the attainment of stated targets. Performance indicators are listed for 29 categories
Annual reports—Both Main Roads and Queensland Transport provide comprehensive annual reports that outline the progress made on each agency's strategic plan. The performance of each agency's core business areas is reported, and transportation system performance is related to key performance indicators (such as road fatalities).
Traffic management reports—Main Roads operates four traffic management centers in Queensland responsible for specific parts of the road network. Each center also acts as a collector of data on network performance.
| "Performance measurement is fundamentally building partnerships that have gone way beyond the boundaries of our individual agencies." |
Strategic performance report—Main Roads has implemented a new performance-reporting scheme for senior management that provides quarterly information on 20 key indicators. The intent of this performance report is to focus senior management attention on the aspects of transportation system performance and the Main Roads indicators that warrant more concentrated attention. The indicator information is presented in red, yellow, and green to highlight the most serious performances, those deserving concern, and those meeting targets.
Performance indicators are also used to produce network and route reports. Figure 11 shows how the data collected for the performance measurement program can be used for more operational decision-making.
One interesting characteristic of the performance measurement strategy in Queensland is the continual reevaluation of the process and consequent efforts to improve it. Research and thinking are examining different ways of characterizing transportation system performance and how this performance relates to broader goals. A multimodal performance framework is envisioned that consists of modal characteristics by vehicle type, public and private sector, passenger versus freight, freight task type(e.g., bulk, non bulk, and light commercial) , urban versus rural, and destination characteristics of transportation flows. All of these input dimensions are then related to outcomes, such as system use, safety, pollutant emissions, and user/ community costs. The intent is to use this input/ output/ outcome matrix to monetize the value of the relationships between cause-and-effect variables. By establishing this monetary relationship, Queensland Transport will be able to prioritize proposed initiatives and projects by the expected value added to outcomes. In addition, the monetary values associated with key input/ output/ outcome relationships can be used to benchmark Queensland's performance with other Australian states.
| "You can have all the indicators you want, but sooner or later you have to think about it."—Main Roads official |
Figure 11. Performance-related data for network and route planning in Queensland.
Figure 11a. Route performance report.
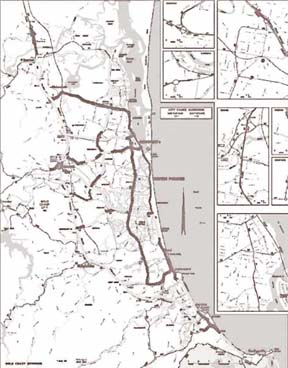
Figure 11b. Network performance report.
Both Main Roads and Queensland Transport have internal audit units whose purpose is to identify operational deficiencies, and to bring to management attention matters relating to agency deficiencies on performance accomplishment. Given the performance management culture of both organizations, the internal audit units have their own performance measures on the outputs that contribute to organizational success (e.g., number of audit reports generated, number of workshops conducted on corruption prevention, and customer feedback).
Safety
The road safety program has benefited the most from a transport performance-based decision-making process in Queensland. A Road Safety Strategywas adopted in 1993 that outlined a long-term action plan for reducing fatalities and personal injuries on Queensland's road network. The approach adopted by Main Roads consisted of several steps based on a "knowledge management" structure developed in the mid-1990s at Harvard University. The steps included the following:
The results of this multifaceted road safety strategy have been impressive (and are reported on more extensively in the chapter on safety). The performance indicators used in the safety category include fatalities and serious casualty crashes per million vehicle-kilometers on state-controlled roads, social cost of crashes, and customer perceptions of safe travel.
Congestion
Population growth in southeastern Queensland, primarily the Brisbane metropolitan area, has occurred faster than in most other areas of Australia. In fact, Brisbane is predicted to have the fastest-growing congestion levels in Australia in the future. Not surprisingly, indicators of congestion and mobility comprise some of the core performance indicators for both Queensland Transport and Main Roads. The congestion/ mobility indicators for both agencies reported in the 2002-2003 annual reports are as follows:
Queensland Transport
System stewardship
Main Roads
Road corridors
Road operations
For road operations, two additional measures relating to traffic flow performance and network use are being developed.
Freight
Because of the substantial expanse of Queensland and the isolation of many rural communities, Queensland has adopted a proactive policy to provide rail and truck transport services to these communities. Unlike the wave of privatization that swept other Australian states several years ago, Queensland has kept government involvement in many aspects of rail freight service and infrastructure. For example, a government-owned corporation called Queensland Rail is responsible for the rail service on many rail lines in the state. The rail infrastructure itself, called "below rail," is owned by the government, which has established a Queensland Competition Authority to regulate competitive access to the rail network for third-party operators. Queensland Transport establishes transport service contracts with service providers that define service and performance requirements. These contracts also specify "community service obligations," activities or services that would not be normally undertaken by a commercial freight operator.
The rail infrastructure contract is for AU$1.5 billion (US$1.1 billion) over seven years and covers 6,540 km (4,064 mi) of track (about 70 percent of the rail network). Performance is measured against contractual requirements with financial penalties charged for poor performance. Base service levels are established in the contract for an overall track condition index ( OTCI ), temporary speed restrictions ( TSR ) , below rail delays, and below rail track availability. Quarterly and annual reports are provided to Queensland Transport that present information on a wide range of performance indicators. The following are the most important:
Queensland Transport officials pointed to several instances when this performance and condition information led to targeted investments to improve the existing situation.
For passenger rail, Queensland Rail monitors on time performance (with a desire to have 95 to 98 percent of trains within three minutes of schedule), cancellations,safety, cleanliness, and number of passenger trips. Again, monitoring these indicators has led to specific actions, such as posting security guards in stations at night and painting a blue line in terminals where patrons can stand to be visible to security cameras.
Similar to the rail network, Queensland's ports are owned by the state, with both the Minister of Transport and Main Roads and the state Treasurer as shareholders. Eight port authorities manage the 15 ports, which are oriented primarily toward export trade. The Government Owned Corporations Act requires that ports operate as much as possible on a competitive basis, but the government can establish financial and non financial performance targets or require port managers to undertake community service obligations, the same as for rail operators. Yearly statements of corporate intent and five-year corporate plans are required of port managers. Not surprisingly, given the competitive nature of the port industry, the performance measures reported to the share holding Ministers must include financial indicators (return on assets, and liquidity and leverage ratios) , non financial indicators(tonnage, berth occupancy, and vessel turnaround time), and compliance with public initiatives (labor relations issues, equal employment opportunity, and budgetary compliance with expenditure procedures). Ports are also permitted to develop their own indicators on trade opportunities, security, logistics efficiency, and maintaining competitive position in the market. For example,six ports report on environmental indicators because of local concern about the environmental impacts of port operations on sensitive nearby areas.
Environmental Monitoring
Part of Main Roads' vision includes "enhancing the environmental well-being of Queensland's communities." To achieve this part of the vision, Main Roads has adopted an environmental management policy and strategy that commits the agency to maintaining ecological processes, protecting bio diversity, improving equity within and between generations, and improving individual and community well-being and welfare. In other words, the policy commits Main Roads to the basic principles of sustainability. Although the environmental record of Main Roads is impressive—and is one of the better records for jurisdictions of comparable size—it was not clear to the scan team how environmental management has been incorporated into the performance measurement regime of Main Roads. Much of the performance measurement relates to monitoring processes and procedures (e.g., 80 percent of traffic management strategies should have an environmental component),as well as monitoring the perceptions of external and internal stakeholders. The team did not find any measures or indicators of ultimate outcomes associated with good environmental management, an observation at almost all the sites it visited.
Queensland Transport has included in its performance indicators several that relate to air quality, including level of noxious motor vehicle emissions, trend in greenhouse gas emissions, and percent of urban bus fleet compliant with Europa 2 and Euro 3 emission standards. These indicators were listed under a "system stewardship" heading.
Data Support
Transport officials in Queensland recognize the need for a strong data collection foundation for performance measurement efforts. One of the most extensive efforts observed during the scan is Main Roads' A Road Management Information System, known as ARMIS . ARMIS is an integrated computer data base management system that processes data collected from numerous sources on Queensland's state-controlled road network. The data collection and quality control for ARMIS occurs in Main Roads' 14 district offices, but the central office coordinates format and operating procedures. Operational systems used in the districts to manage their road systems include road reference/ road inventory, bridge information, pavement condition, traffic analysis and reporting, Road Crash 2, and road maintenance performance contracts management systems.
The Road Crash 2 system is interesting in that it not only records details of crash characteristics such as contributing circumstances, injuries, and locations, but it also ranks crash locations for remedial treatments through benefit-cost ratios and net present values of benefits and costs. The bridge information system also produces a file exported to a which bridge maintenance software package for prioritizing maintenance activities.
Observations
Important observations from the visit to Queensland include the following:
| << Previous | Contents | Next >> |

