U.S. Department of Transportation
Federal Highway Administration
1200 New Jersey Avenue, SE
Washington, DC 20590
202-366-4000
Driving simulators are often used in Europe to assist in the design of roadways, an application that is far less common in the United States. It is much simpler and cheaper to reject a design element in a driving simulator than to rebuild a road or tunnel to fix design errors. The level of fidelity of the simulators (e.g., degrees of motion, picture size and quality, etc.) at the agencies visited was comparable to the range of simulators in use in the United States at universities and FHWA's Turner- Fairbank Highway Research Center.
Simulators have been used both formally, with controlled experiments to conduct tests of driver behavior and approval of project features, and informally, with highway designers using the simulator to experience alternate roadway plans. For example, at VTI Sweden an informal simulator project was described in which highway designers had planned to visit for one day to view their new designs in the simulator, but stayed for three days and made several design changes based on their simulator experience.
An excellent example of a formal evaluation of alternate roadway designs used a medium-fidelity driving simulator at SINTEF in Norway. SINTEF was asked to help design the longest tunnel in the world in western Norway (figure 11). Experiments were undertaken to evaluate four tunnel models (figure 12). Results showed that lighting strategies using blue, yellow, and green lights increased driver safety and comfort. A major challenge in constructing long tunnels is reducing driver anxiety, because many drivers feel uncomfortable in this environment. Changes in lighting every 2 km (1.2 mi) reduced driver anxiety. Including some large openings (figures 13 and 14) inside the tunnel also reduced driver anxiety and was useful for emergency operations.
These design strategies have proved to be successful with high ratings of driver comfort in the tunnel and no crashes. In addition, the Laerdal project has won two European lighting awards.
Figure 11. The Laerdal Tunnel project. (SINTEF)
Figure 12. Alternate lighting models for the Laerdal Tunnel. (SINTEF)
Figure 13. Improved design of rock cavern and roundabout increased safety and comfort. (SINTEF)
Figure 14. Rock caverns. (SINTEF)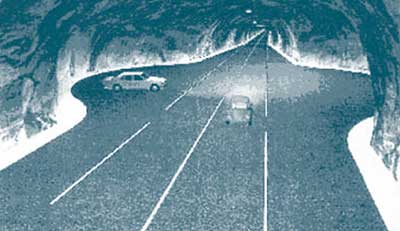
Figure 15. Ernest Huckaby, Tore Knudsen, and Barry Kantowitz discuss SINTEF's mission.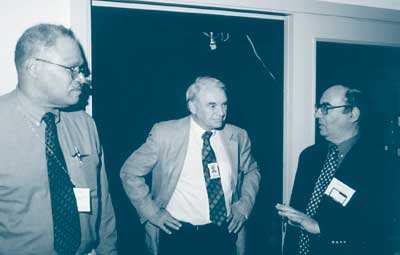
Figure 16.Gunnar Jenssen explains self-organizing roads. (SINTEF)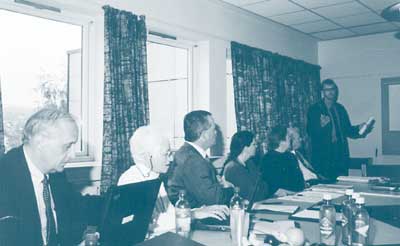
Figure 17. Scan team members Tom Granda and Leanna Depue ride in the SINTEF driving simulator.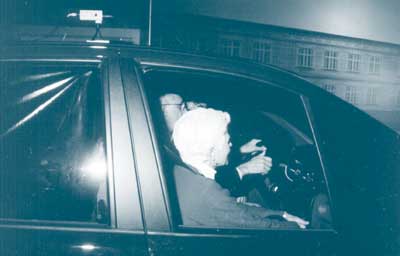
Driving Simulators Contact Information
Dr. Tore Knudsen
NO-7465
Klæbuveien 153
Trondheim, Norway
Phone: +47 73 59 46 60
tore.knudsen@sintef.no
http://www.sintef.no/
Mobile : 47 92 61 94 13
Fax: 47 73 59 46 56
E-mail: tore.knudsen@sintef.no
Phone: +46 36 19 20 18
The Stockholm Ring Road (figure 18) is a major construction project including tunnels and underground junctions. The VTI simulator (figure 19) was used to help design this project. A virtual tunnel was created, based on drawings, photographs, models and discussions (figure 20). Simulation results were helpful in several ways:
Figure 18. The Stockholm Ring Road - 25-km (15.5-mi) tunnels with underground junctions.(VTI)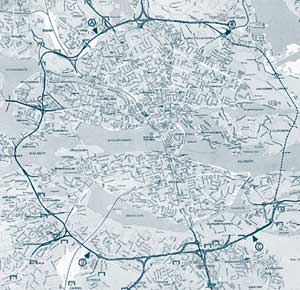
Figure 19. VTI's driving simulator hall. (VTI)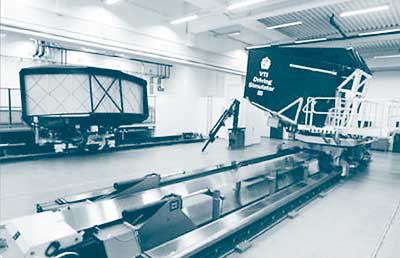
Figure 20. The virtual tunnel defined by combining data from several data sources: drawings, photographs, models, and discussions. (VTI)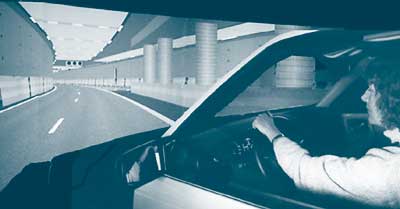
Stockholm Ring Road Contact Information
Mats Lidström
VTI
SE-581 95 Linköping
Sweden
Phone +46 13 204 392
mats.lidstrom@vti.se
www.vti.se
The INRETS driving simulator has been used in several projects with a four-step process:
An example of this process is contained in the STARDUST project, which evaluates the impact of a lane-keeping system in an urban environment. When lanes are narrow, speed decreases, causing a decrease in system capacity. In the first step, simulator results demonstrated such speed decreases without lane-keeping assistance. In the second step, the lane-keeping system prevented a 15 percent decrease in speed. A traffic study corresponding to step three is now in progress. Table 3 summarizes other simulator studies performed at INRETS.
| AIDA | Goal: Assess in simulation the impacts of the AIDA system on traffic and safety conditions. |
| ARCOS | Goal: Design new safety functions for managing distance gaps between vehicles; prevent collisions on fixed, stopped, or slow obstacles; prevent off-road crashes; alert vehicle to related crashes/incidents downstream on the route. |
| DIATS | Goal: Study, deployment scenarios of telematic devices in interurban areas. Study, features related to legal issues, market demands, and impacts of the introduction of such systems on traffic and safety. |
| MICADO | Goal: Study an alert anticollision system based on a multisensor. Develop tools for virtual prototyping of such a system. |
| NOR | Goal: Study a new concept of road infrastructure from the standpoints of user perception and traffic characteristics. |
| SAM | Goal: Study the impact of a transmission system for alert messages from vehicle to vehicle. Measure the efficiency of the system at the individual level on the driving simulator and at the collective level through simulation studies. |
| STARDUST | Goal: Study the deployment scenarios for driving aid devices in an urban environment, aspects of social and economics issues, and the impacts of introduction of such systems on traffic and safety. |
| VOIR | Goal: Extend the use of simulators to cover degraded driving conditions, day and night, because of reduced visibility. Ambient luminosity, secular reflections, and dynamic light sources are simulated. |
Traffic Systems Studies Contact Information
Stéphane Espié
INRETS-ARCUEIL
2, Avenue du Général Malleret Joinville
94114 Arcueil Cedex
France
Phone +33 (0)1 47 40 70 23
espie@inrets.fr
www.inrets.fr
People drive real cars on real roads; driving simulators create an artificial driving environment. Before results from driving simulators can be safely applied to road design and traffic systems, these results must be validated. Validity is accomplished by comparing simulator data to on-road data. Simulators must be validated anew for each research question. At TNO, an organization with almost 30 years of experience using driver simulators, the following points were made about validation:
Simulator research provides relative validity more often than absolute validity. What is more important is the ability to predict road behavior from simulator behavior. For example, a common finding is that people drive faster in simulators than on the road. One explanation for this finding is that because simulators lack the visual detail of the real world (i.e., the real world has more pixels), drivers attempt to match the optical flow of the real world and so drive faster in the simulator. This lack of absolute validity is seldom a problem because speed corrections can be made when predicting real-world behavior from simulator behavior. For example, if it were known that drivers drive 5 km/h faster in the simulator, the real-world prediction would be obtained by subtracting 5 km/h from the simulator results. Furthermore, in many cases relative validity is sufficient to give useful direction to highway and traffic engineers.
Figure 21. Researcher Selma de Ridder explains driver behavior.
Validity Contact Information
Selma de Ridder
TNO Human Factors
Kampweg 5, PO Box 23
3769 ZG Soesterberg
The Netherlands
Phone +31 346 356 355
deridder@tm.tno.nl
www.tno.nl
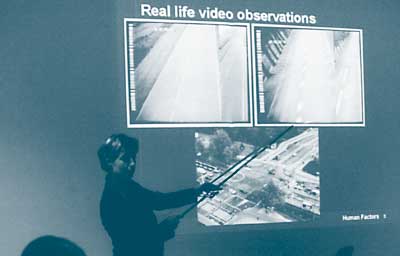
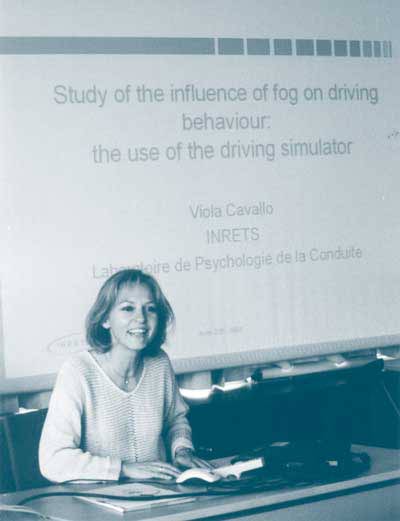
This study is an outstanding example of going to great lengths to achieve appropriate simulator validity. It is difficult to study the effects of fog on the road because fog is a rare occurrence. The image generation techniques used to simulate fog have limited realism, however, and most simulator manufacturers have not validated the effects of fog on driver behavior. This INRETS study went to an artificial fog chamber to investigate human perception in daytime and nighttime fog. Visibility of vehicle outlines (daytime) and rear light configurations (nighttime) were empirically evaluated. While the fog chamber has the considerable advantage of producing real fog, its limited dimensions prevent placing moving vehicles inside the chamber. Thus, the researchers reproduced the fog chamber experiments in the simulator to validate various fog image generation techniques. They were able to validate effects for daytime fog, but not for nighttime fog (probably because of the limited luminance range of the simulator projection device). This allowed studies of speed perception and control in daytime fog that offer greater validity than previous simulator fog studies, a most impressive accomplishment.
Figure 22. Researcher Viola Cavallo presents fog simulation results.
Influence of Fog on Driving Behavior Contact Information
Viola Cavallo
INRETS
Laboratoire de Psychologie de la Conduite
2 av. Général Malleret-Joinville
F-94114 ARCUEIL CEDEX FRANCE
Phone: (0)1 47 40 73 64
cavallo@inrets.fr
www.inrets.fr
The fidelity of a simulator is related directly to its cost. Simulators can be purchased for under $50,000 (low fidelity), from $50,000 to $250,000 (medium fidelity), and up to several millions of dollars (high fidelity). Higher prices add a moving base, more screens, better graphics, and faster system response times (figure 23). If one wishes to simulate vehicle dynamics and control, a high-fidelity simulator (figure 24) is necessary. However, many important driver behaviors are studied successfully in medium-fidelity simulators, especially when driver cognitive behavior and decisionmaking are the objects of inquiry. Thus, medium-fidelity simulators are more cost effective for studying roadway design in most cases. Table 4 shows the benefits and costs among different classes of simulators.
Figure 23. Barry Kantowitz, report facilitator, participates in meeting on high-fidelity driving simulators.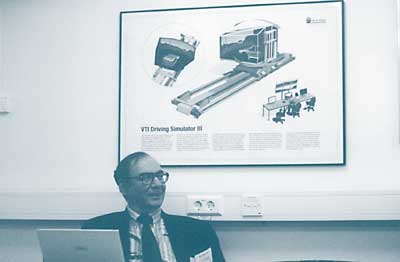
Figure 24. VTI Driving Simulator III.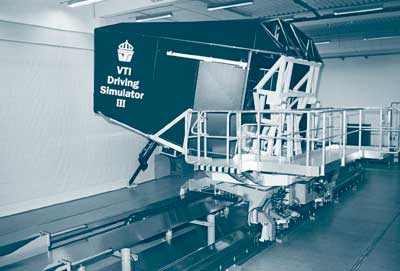
| Benefits/Costs | Low-Fidelity Simulation | High-Fidelity Simulation | On-the-Road Studies |
|---|---|---|---|
| Ability to study relevant driver behaviors | Medium-High | High | Medium |
| Ability to study range of highway geometrics | High | High | Medium |
| Ability to study range of traffic conditions | Medium | High | Medium |
| Control over experimental conditions | Medium-High | High | Medium |
| Degree of realism | Medium | Medium-High | Very High |
| Relative cost | Medium | High | High |
| Risk to driver | Very Low | Very Low | Low-Medium |
Simulator Fidelity Contact Information
Dr. Barry Kantowitz
UMTRI
2901 Baxter Road
Ann Arbor, MI 48109-2150
Phone: (734) 936–1046
barrykan@umich.edu
www.umtri.umich.edu
| << Previous | Contents | Next >> |

