U.S. Department of Transportation
Federal Highway Administration
1200 New Jersey Avenue, SE
Washington, DC 20590
202-366-4000
As noted in preceding chapters, the scan team observed one of the most impressive applications of performance measurement-including its impact on agency decision-making and resulting outcomes-in the area of safety. Particularly in Australia and New Zealand, but also in British Columbia and Japan, government policy has been to focus resources-engineering, enforcement, and education-on the goal of reducing road fatalities and injuries. The way this has occurred illustrates well the impact performance measurement can have on ultimate outcomes.
Before discussing the steps resulting in these outcomes, it is perhaps most appropriate to begin with what countries have been able to accomplish. Figure 27 shows the trends in road-related fatalities for two Australian states. As can be seen, the record is impressive.
Although each country and state has approached road safety in its own way, several common steps in their approaches provide important lessons to those interested in putting in place a planning and decision-making process that could have as significant an impact. These steps are illustrated below with examples from sites visited during this scan.
Figure 27. Record of road fatalities in New South Wales and Victoria.
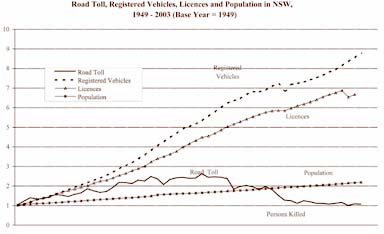
Figure 27a. New South Wales road crash toll.
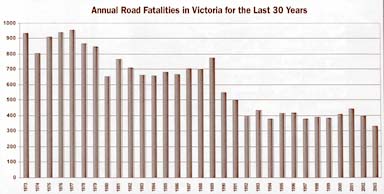
Figure abdicatord crash toll.
Before one can identify the types of strategies or investments that could reduce the road toll, one must understand the problem itself. This means not only understanding the big picture from the perspective of numbers and incidence of road-related fatalities and injuries, but also becoming knowledgeable about the leading factors that cause such an outcome. The best examples of a performance-based approach to improving road safety began with the comprehensive collection and analysis of data, which often included conducting research on the most important factors leading to a fatality or personal injury. For example, the Japanese know through detailed analysis of crash data that a disproportionate number of crashes involve pedestrians and bicyclists, and that a large percentage of these involve elderly individuals in crashes close to home. This knowledge led the Ministry of Land, Infrastructure, and Transport to emphasize pedestrian-oriented safety measures in its performance measurement and in the strategies adopted to improve this record.
In Victoria, analysis of crash data showed that in rural areas, run-off-the-road crashes were by far the most significant type of fatality crashes, while in urban areas, side hits were at the top of the list. In addition, in Victoria, New South Wales, Queensland, and New Zealand, the high incidence of alcohol-related fatal crashes and excessive speeds led to targeted enforcement measures that have had an important impact. As seen in figure 28, VicRoads research indicates that in a 60 km/ h (37 mi/h) speed zone, for every increase in travel speed of 5 km/ h (3 mi/ h) above the limit, the risk of casualty crash involvement doubles. This result has been a cornerstone for a public education/ marketing safety campaign.
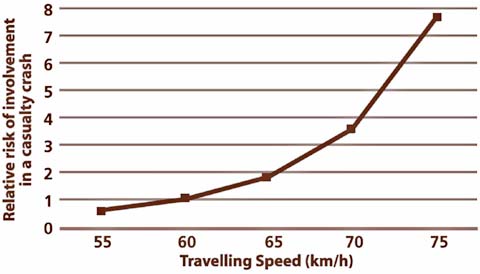
Figure 28. Crash research results in Victoria.
Another example of understanding the characteristics of the crash phenomenon is found in Queensland, where Queensland Transport conducted detailed analysis of crash data to determine which factors are more likely to be present when fatalities occur. Figure 29 shows the type of analysis that served as the foundation of this assessment.
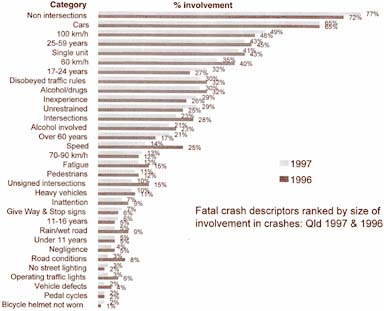
Figure 29 . Ranking crash-related factors in Queensland.
All of the countries, states, and provinces the scan team visited had fairly clear lines of responsibility for implementing the safety program. In Victoria, a ministerial road safety executive committee has been established consisting of the Ministers for Roads, Transport, Police, and the Transport Accident Commission. In New Zealand, a National Road Safety Committee includes representatives from the Land Traffic Safety Authority, Ministry of Transport, Transit New Zealand, Transfund New Zealand, New Zealand Police, Accident Commission, and local governments. The purpose of this committee was to act as a forum for "communicating, coordinating, and agreeing to top-level strategy between agencies on road safety issues." In New South Wales, RTA is the lead road safety agency, and to carry out its mission it has developed strong partnerships with the New South Wales Police for enhanced enforcement, Motor Accidents Authority for education campaigns, Department of Corrective Services for alcohol programs, Department of Education and Training for school and youth education programs, local governments for a Road Safety Officer program, Department of Health for injury risk management research, and many others such as the attorney general, transport service providers, and community groups.
In British Columbia, the Ministry of Transport meets regularly with representatives of the Insurance Corporation of British Columbia ( ICBC ) and Royal Canadian Mounted Police ( RCMP ) and other agencies to coordinate approaches to enhancing highway safety. The Ministry of Transport and ICBC use a common database derived from police reports. The Ministry of Transport's Highway Accident System is both a database and a main analysis tool to support business cases for capital improvement projects. RCMP and the Ministry of Transport have been proactive about sharing experiences and conclusions to advance safety initiatives. ICBC prepares an exhaustive annual report on traffic collision statistics (available at ICBC annual report on traffic collision statistics )
Two observations from the scanning study on the institutional structure for safety are of interest. The first relates to the role of the police in the safety program. Similar to the United States, police agencies are critical partners in any road safety program and, in Australia and New Zealand in particular, work closely with the transportation agencies to implement the government's safety policy. The team's impression was that this coordination is much closer than often found in the United States, most likely because in several instances the police agency is a state (or in New Zealand's case, a national) organization. That means police agencies answer to the same executive authority as transportation agencies, and have their own performance measures linked to the desired outcomes of the government's policy. Second, in British Columbia, Australia, and New Zealand, government-created third-party insurance corporations play important roles in road safety. In both British Columbia and Victoria, for example, these public corporations annually invest in projects aimed at improving the safety record, including road safety construction projects.
The best examples of performance-based safety planning were based on clear desired outcomes, most often emanating from government policies. In Japan, the government has established a target of 30 percent reduction in injury crashes at the country's top crash locations. In Victoria, the government has established a 20 percent reduction in road-related fatalities as its 2007 goal. In some cases, desired outcomes could relate to specific markets or user groups, such as reducing fatality and personal injury crashes involving young drivers, while in others they could focus on specific causes of crashes, such as reducing alcohol-or drug-related crashes. No matter the focus of the desired outcome, a key factor in all of the effective performance measurement efforts found in this scan was establishment of an achievement target. By setting such a target, the agencies responsible for helping achieve this outcome became more involved in understanding how their actions could help its achievement.
Once a goal has been established or articulated, the next step is to identify performance indicators that relate to both the desired outcome and the organizational outputs expected to lead to that outcome. Chapter Two described the types of indicators used to monitor both transportation system performance and process accomplishment in the countries the team visited. In most cases, transportation agencies have adopted a range of indicators, usually with "number of fatalities" as the most important measure. In several cases, this was reported along with fatalities per 100,000 inhabitants, fatalities per 10,000 motor vehicles, and crash rate per million vehicle-kilometers traveled.
Another important observation on fatality indicators is that, in some instances, the agencies have adopted a total societal or social cost approach to measurement. This implies that the impact on society of a death is valued in a fairly broad context.
All of the sites the team visited compared their safety (as well as other) performance measures with those found in other jurisdictions. This was done primarily to determine whether the record was out of the ordinary. In most cases, this comparison became a screening tool to identify major differences. If significant differences were found, this led to further examination to determine why. Was it simply because such significant differences existed among the jurisdictions that the comparisons were invalid? Or could the differences in the results be linked to government actions that had affected the outcomes?
A typical comparison effort is shown in figure 30. In this case, VicRoads compared the safety experience in Victoria with that of other Australian states and selected other countries. It is interesting to note that Australian officials looked mainly at the Netherlands, Sweden, and the United Kingdom as models to emulate.
A key to the success of national and state road safety programs is the existence of a data collection and analysis system that provides continual information on the safety performance of the transportation system. This information is used to monitor progress toward performance targets, identify topics or areas where further action is necessary, educate officials and the public on the importance of the topic, and evaluate the effectiveness of implemented projects and strategies. The best road safety programs had at their foundation a systematic and comprehensive database management and analysis program. These programs were called by different names, including the Crash Analysis System in New Zealand and the Road Crash Information System in Victoria. The key was to take the data being collected on a wide range of factors linked to road safety and turn it into information that transport and road safety officials could use to determine the most cost-effective actions to meet their performance targets (see figure 31).
.jpg)
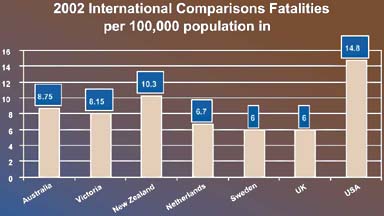
Figure 30. Examples of crash data comparison by VicRoads .
"There is no need to collect all of this data on crashes if you are not going to use it to make decisions!"- VicRoads official
In each case where this database management capability existed, it used geographic information system ( GIS ) technology to portray the locations and characteristics of the most recent crash history. In Victoria's case, this was done daily. VicRoads ' Road Crash Information System provided up-to-date information on the status of program and project implementation, identification of the worst locations for different types of crashes (e.g., where did most of the run-off-the-road crashes occur?), public information on crash statistics, updates on the government's performance indicators, and trends in safety characteristics that allow transport, safety, elected officials, and the public to determine the severity of the road safety challenge.
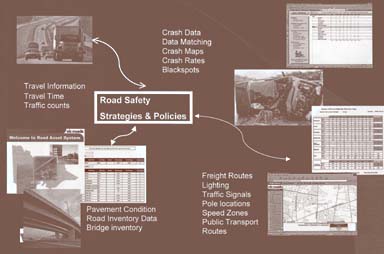
Figure 31. Creating road safety knowledge from data at VicRoads .
In the Australian states and New Zealand, the government developed a road safety plan that outlined the road safety problem, challenges being faced, performance targets that had been established, actions being considered, and institutional responsibilities for carrying out the plan. Often, these plans were not developed by the transportation agencies, but by the government. Because of the way government is structured, these policies have been incorporated into the planning, program development, and performance monitoring activities of the transportation and safety agencies in each jurisdiction. As noted in the VicRoads ' Road Safety Strategic Plan 2004/ 05, the government's strategy called arrive alive!"continues to provide the over arching strategic direction for VicRoads ' Road Safety Program, with a target to reduce annual death and serious injuries from road crashes by 20 percent by 2007."
Safety plans usually consisted of a range of strategies, actions, and projects. Identifying the most appropriate combination of actions comes from both a technical process that identifies the likely effectiveness of different strategies and a political/ public assessment of what might be feasible. Figure 32 illustrates conceptually the process that the Land Transport Safety Authority in New Zealand went through to identify the most appropriate direction for its safety program. This process included a technical analysis of strategies most likely to have the greatest impact, and a public outreach effort that sought feedback from groups on what they thought was the best direction. In this case, the package of actions chosen included a mix of enforcement and engineering strategies.
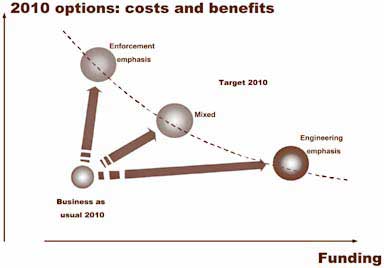
Figure 32. Safety program analysis in New Zealand.
One of the most important (and impressive) actions undertaken by the Japanese, Australians, and New Zealanders was determining the effectiveness of implemented strategies and actions. For example, in New Zealand and all of the Australian states visited, transportation officials had a good sense of the impact each implemented strategy had on reducing fatalities and personal injuries. Figure 33 shows an assessment from Queensland and Victoria that relates reduction in fatalities to government action.
Figure 33. Assessing effectiveness of implemented actions.
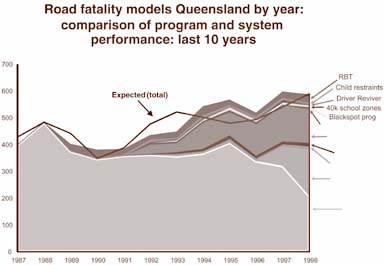
Figure 33a. Effectiveness of safety actions in Queensland.
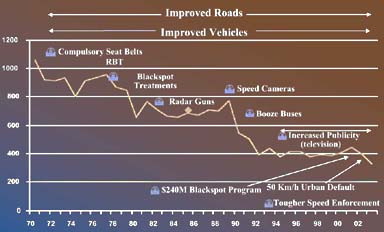
Figure obstructiveness's of safety actions in Victoria.
The team observed another interesting example showing the effectiveness of safety actions in Melbourne, where Victoria police use speed cameras (with advance warning signs) and ticketing through the mail to reduce the high levels of speeding occurring on Melbourne roads. When research showed that high speeds were a major contributor to fatalities, the government implemented an aggressive speed-enforcement effort. Using of both fixed and mobile speed cameras has had a significant impact on speeds, as figure 34 shows.
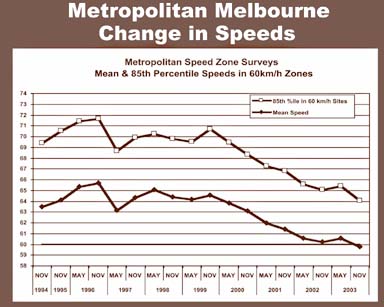
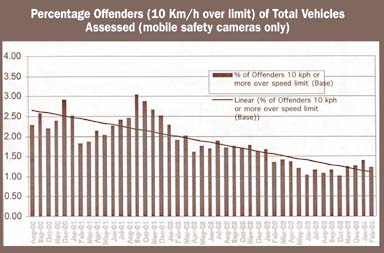
Figure 34. Impact of speed camera enforcement on road speeds in Melbourne.
The most effective safety programs the scan team observed in its study used the eight steps described above. Although some actions used in these programs could be difficult to implement in many U.S. jurisdictions, such as random breath and blood tests and widespread use of speed cameras, the scan team believes much can be learned from the Australian and New Zealand experience. In particular, the way road and safety officials have integrated safety concerns into their agency's planning and decision-making and the importance they place on safety performance measures present a useful road map on how the United States could elevate safety concerns to a higher level.
| << Previous | Contents | Next >> |

