U.S. Department of Transportation
Federal Highway Administration
1200 New Jersey Avenue, SE
Washington, DC 20590
202-366-4000
The mission statement for the national road agency in New Zealand states that it wants to be a world leader in transportation service provision. In many areas, New Zealand has accomplished this, earning a reputation for innovative and forward- looking approaches to transportation system management. In combination with its public and governmental concern for natural resources, New Zealand includes many best practices on how the transportation system can best be developed and managed to support much broader community goals. The scan team was particularly interested in how transportation officials in New Zealand used performance measures to manage their transportation system, and the extent to which performance measures have been identified for social, environmental, and cultural outcomes.
Governmental Context
New Zealand is a parliamentary democracy with a unicameral Parliament. The country is divided into 16 administrative regions and 74 territorial authorities, all of which are road-controlling authorities. A minister oversees a Ministry of Transport that consists of six agencies—Civil Aviation Authority, Transport Accident Investigation Commission, Maritime Safety Authority, Land Transport Safety Authority, Transfund New Zealand, and Transit New Zealand. Three agencies in particular were of interest to the scan team. Transit New Zealand is the agency responsible for a national highway system consisting of 10,786 km (6,702 mi) of a road network of 92,600 km (57,450 mi). About 48 percent of New Zealand's 38 billion vehicle-kilometers per year (23.6 billion vehicle-miles) use the national highway network. About NZ$674 million (US$493 million) will be spent on the national road network in 2004.
Transfund New Zealand is the agency that allocates all revenues collected from the fuel excise tax, gas taxes, and vehicle registration fees to national transport and safety agencies. The initial allocation from the National Roads Fund ( similar to the U.S. Highway Trust Fund) goes to the New Zealand Police and the Land Transport Safety Authority for road safety enforcement. The remaining funds are transferred to the National Roads Account, which provides full funding of the road program of Transit New Zealand, together with financial assistance to the programs of the local government road-controlling authorities. Transfund New Zealand uses its own performance measures to monitor progress on government and agency goals.
The Land Transport Safety Authority ( LTSA ) is a crown entity with a mandate to promote land transport safety, including safety on New Zealand's road and rail network. LTSA is governed by a government-appointed board. With its responsibility targeted to safety, LTSA has established goals on the number of annual deaths and hospitalizations in New Zealand. Its outreach efforts are divided among education, enforcement, and engineering. Given that it must rely on achieving its goals through the actions of other agencies (e.g., New Zealand Police and Transit New Zealand), LTSA develops and nurtures partnerships with many other agencies at the national, state, and local levels.
Use of Performance Indicators
Similar to Australia, New Zealand has developed an integrated approach to performance-based planning and decision-making. Consistent performance measures are found in documents ranging from its corporate strategic plan to performance specifications in private service contracts. Figure 24 shows the hierarchy of management decision-making and its relationship to performance measurement. Several inputs and products of this process merit special attention.
Enabling legislation—More than in many other countries, the New Zealand government has established strong goals for the transportation sector as it relates to the general well being of the country. For example, a Land Transport Management Act passed in 2003 requires Transit New Zealand ( and other major agencies) to operate in a way that "contributes to an integrated, safe, responsive, and sustainable land transport system." The important word in this phrase is "sustainable," because the government has set a June 30, 2005, target date for all land transport programs to be fully compliant with the policy directions in the act. At the time of the scan visit, Transit New Zealand officials were struggling with how the transportation program should be restructured and system performance measures defined to lead to a more sustainable land transport system for New Zealand.
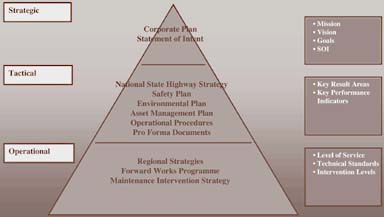
Figure 24. Role of performance measures in management decision-making in New Zealand.
A law expected to pass shortly after the scan visit would change the way transportation governance occurs in Auckland, New Zealand's largest city. Under the law, a new planning organization would be established for the region with a requirement for local land use plans to be closely tied to roads and public transport plans. This new law was expected to change in significant ways how transportation planning occurs in Auckland, and once again, challenge planners and decision makers to develop a performance measurement scheme that measures progress toward this goal.
New Zealand Transport Strategy—The government produced a strategy document in 2002 that outlined its strategic vision for transportation: "By 2010, New Zealand will have an affordable, integrated, safe, responsible, and sustainable transport system." Four principles underpinned this vision—sustainability, integration, safety, and responsiveness. Although no specific performance indicators were identified in this document, the Land Transport Management Act required that all related actions by the national transportation agencies be consistent with this strategy.
Strategic Plan—Each agency must develop a strategic plan that describes what the agency is trying to achieve and how it will achieve it. The most recent strategic plan for Transit New Zealand, for example, stated its mission, vision, values, key strategic areas, and key goals. As the plan noted, Transit New Zealand is focused on performance in several areas, including state highway network management, social and environmental responsibility, funding, industry leadership, communication, and working relationships. The strategic plan observed that Transit New Zealand wanted to reexamine its performance measures, which it concluded focused primarily on delivering physical outputs. Instead, Transit New Zealand's aim was to develop performance measures that reflected "the full range of Transit New Zealand's role, accountabilities, and performance; performance targets in the Strategic Plan and the National State Highway Strategy; and Triple Bottom Line reporting."
Statement of Intent—A 1989 public finance law required all government agencies to prepare a document that provided information on a range of corporate management factors, including performance targets, objectives, and scope of activities. For example, the Ministry of Transport's Statement of Intent for 2003/ 2004 observed that, "Sustainable Transport is the Ministry's vision. As the government's principal transport advisor, we will continue to identify solutions with longer-term benefits. Decisions will be based not only on monetary costs and benefits, but will also take into account the social, regional, economic, health, and environmental impacts of all projects."
Transit New Zealand's statement of intent provides a more detailed set of performance measures that relate to the goals established in the strategic plan. In addition, these performance measures include measures that are part of a performance agreement between the Minister of Transport and Transit New Zealand (see below). As noted in the statement of intent, given the changes in the law and increasing pressure on Transit New Zealand to broaden its interests, these performance measures are a starting point for future performance measure evolution. Indeed, during the scan meeting, it became clear that some measures were considered placeholders until more substantive measures could be defined. One consequence of this was that customer surveys are used in Transit New Zealand's performance measurement system more than in other cases the team observed. The performance measures for Transit New Zealand are found in Appendix C, identified by the three areas found in the triple bottom line approach to performance measurement.
Performance Agreements—The Land Transport Management Act requires that Transfund and Transit New Zealand provide the Minister of Transport with an annual performance agreement that specifies how the agency will conduct its activities during that year. Of the 11 topics covered in this agreement, eight relate to some form of performance measurement, including a proposed statement of output objectives, how the agency will measure achievement of the government's goals, management and financial systems that will guide agency action, and an assessment of the agency's actions on achieving an integrated, safe, responsive, and sustainable highway system.
The latest performance agreement between the Minister of Transport and Transit New Zealand sets targets for seven measures during the year covered by the agreement, and commits to information-gathering activities for other performance measurement areas that will lead to identified targets for the following year. An example of a performance agreement target is that the variance between actual and forecasted expenditures for maintenance should not be more than 2 percent. Given the focus of the performance agreement, the scan team was not surprised to find that all quantifiable targets were focused on organizational outputs, although indications were strong that system performance measures would be incorporated into future performance agreements.
Ten-Year Highway Plan—Transit New Zealand is required to develop a 10-year plan that consists of an annual work program and an "indicative" plan for the remaining nine years. The relationship between this plan and all other performance-based planning documents is found in its linkage to the New Zealand Transport Strategy and Transit New Zealand's National Highway Strategy. In both cases, the 10-year plan states the specific goals the plan is helping to achieve.
Annual Program—An annual program of activities is prepared for each government agency. For example, in the safety area, the annual program includes the engineering, education, and enforcement efforts the government will conduct. Specific performance measures are used to gauge the level of program activity. In the area of speed control, for example, the New Zealand police ( all police are part of a national police force) are charged with delivering enforcement efforts that meet the following performance criteria:
| Measure | Standard |
|---|---|
Quantity |
|
| Number of speed control campaigns and specified police hours compared to target number |
100% |
| Tickets issued from |
|
| -On-road speed enforcement |
275,000 to 325,000 |
| -Traffic camera operations |
400,000 to 460,000 |
Quality |
|
| Number of approved plans | 100% |
| -Percentage of local authorities and Transit New Zealand satisfied with effort | Equal to or better than previous year |
| -Percentage of annual survey respondents who believe the probability of being detected for illegal speeding is high | Equal to or better than previous year |
Timeliness |
|
| Speeding tickets issued no later than 30 days after camera detection | 100% |
Cost |
|
| Delivery within budget | 100% |
The strategic framework for safety performance has led the Land Transport Safety Authority to expand the focus of performance management beyond road user measures to measures relating to the roads themselves. To some extent this was done in recognition of how difficult it might be to use additional behavioral strategies to reduce fatalities. As noted in the safety program document, "roads must be used properly if they are to be safe, and it is up to the engineers who design them to make them as safe as possible and to inform us of the limitations so that we can use the roads safely."
Safety
As in Australia, safety was one of the best examples of the application of performance measurement the scan team observed in New Zealand. Figure 26 shows the overall framework of performance management adopted by the Land Transport Safety Authority, including identification of performance targets for variously defined outcomes and outputs. These different levels of outcomes relate to targeted interventions by the government, and to better measurement of the effectiveness of safety programs on different user groups. Figure 25 also shows the hierarchical nature of the relationship among these outcome levels. The Road Safety to 2010strategic plan for the Land Transport Safety Authority provides more detail on desired levels of achievement. For example, the following outcome categories are found in this strategic plan:
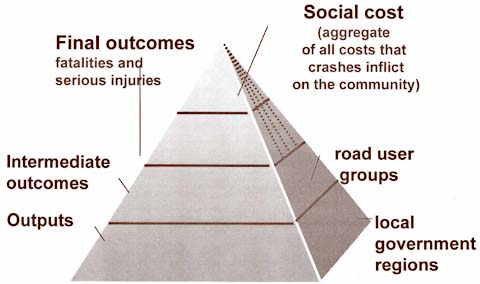
Figure 25. Hierarchical relationship of safety performance measures in New Zealand.
Overall Outcomes
The social cost of a crash is the measure of all costs that the crash inflicts on a community.
| Measure | How Measured | 2004 Not Exceeding | 2010 Not Exceeding |
|---|---|---|---|
| $ billion (US$) |
2.75 (2.01) |
2.15 (1.57) |
|
| Social |
¢ per vehicle-kilometer (US¢ per vehicle-mile) |
6.7 (3.1) |
4.4 (2.0) |
| Costs |
$ per person (US$) |
700 (512) |
650 (476) |
| $ per vehicle (US$) |
1,020 (747) |
945 (692) |
|
| Total not greater than |
400 |
300 |
|
| Deaths |
Rate per billion vehicle-kilometers (per billion vehicle-miles) |
9.9 (6.2) |
6.1 (3.8) |
| Rate per 100,000 persons |
10.2 |
7.3 |
|
| Rate per 10,000 vehicles |
1.5 |
1.1 |
|
| Total not greater than |
5,870 |
4,500 |
|
| Rate per billion vehicle-kilometer (per billion vehicle-miles) |
140 (87) |
90 (55.4) |
|
| Hospitalizations |
Rate per 100,000 persons |
150 |
110 |
| Rate per 10,000 vehicles |
22 |
16 |
|
| Hospitalizations >1 day |
2,750 |
2,200 |
|
| Hospitalizations >3 days |
1,750 |
1,400 |
Note: Values in parentheses indicate comparable U.S. amounts
Intermediate Outcomes
The focus of the intermediate outcomes is to be able to determine the effect of interventions in three key areas—speed management, drunk driving, and passenger/ driver restraints.
| Intermediate Outcome | Measure | Units | 2004 Not Exceeding |
|---|---|---|---|
| Speed (Open Road) |
Mean speed 85th percentile speed |
km/ h (mi/ h) km/ h (mi/ h) |
99 (61.5) 107 (66.5) |
| Speed (Urban Road) |
Mean speed 85th percentile speed |
km/ h (mi/ h) km/ h (mi/ h) |
55.2 (34.2) 61 (37.9) |
| Alcohol |
Driver deaths with excess alcohol |
Number |
48 |
| % of all driver deaths |
21% |
||
| Restraints |
Vehicle occupants wearing safety belts |
% in front % in back |
At least 92% At least 75% |
| Children <12 restrained |
% |
90% |
User Group Outcomes
These outcomes focus on the social costs associated with crashes in two groups—pedestrians and cyclists—because of their particular vulnerability when involved with motor vehicles.
| User Group | Measure | 2004 Deaths plus hospitalization not exceeding |
|---|---|---|
| Pedestrians |
Total More than 1 day hospitalized More than 3 days hospitalized |
700 390 290 |
| Pedestrians per million hours traveled |
Total More than 1 day hospitalized More than 3 days hospitalized |
3.1 1.7 1.3 |
| Cyclists |
Total More than 1 day hospitalized More than 3 days hospitalized |
270 130 90 |
| Cyclists per 100 million km cycled |
Total More than 1 day hospitalized More than 3 days hospitalized |
100 50 35 |
Regional Outcomes
Outcomes can also be disaggregated by region to determine the effectiveness of regional and local road safety projects.
| Region | 2004 deaths plus hospitalization | 2004 deaths plus hospitalization of >1 day | 2004 deaths plus hospitalization of >3 days |
|---|---|---|---|
| Northland |
440 |
200 |
120 |
| Auckland |
2,120 |
840 |
600 |
| Waikato |
740 |
420 |
320 |
| Bay of Plenty |
490 |
270 |
160 |
| Gisborne |
70 |
40 |
30 |
| Hawke's Bay |
250 |
140 |
100 |
| Taranaki |
120 |
70 |
50 |
| Manawatu-Wanganui |
390 |
240 |
160 |
| Wellington |
320 |
200 |
120 |
| Nelson-Marlborough |
140 |
80 |
50 |
| West Coast |
90 |
40 |
20 |
| Canterbury |
700 |
380 |
260 |
| Otago |
250 |
150 |
100 |
| Southland |
150 |
100 |
60 |
A similar outcomes hierarchy is being developed for rail safety.
Safety Partnership
Transit New Zealand is an important implementing partner with the Land Transport Safety Authority, as is the New Zealand police agency. Indeed, before the most recent redefinition of Transit New Zealand's goals as manifested in the Land Transport Management Act of 2003, the principal purpose of the agency was defined as providing "a safe and efficient state highway system." In response, Transit New Zealand undertook several initiatives to incorporate a concern for safety into its daily activities.
Of interest to the scan team was development of a state highway safety management system, defined as "a systematic process that has the goal of reducing the number and severity of road crashes by ensuring all opportunities to improve state highway safety are identified, considered, implemented, and evaluated as appropriate, in all phases of highway planning, design, construction, operation, and maintenance." This management system has three major elements—primary components, secondary components, and partnerships. Figure 26 shows how the management system functions in influencing decisions and budgets. Because many of Transit New Zealand's operations and maintenance activities are contracted to private firms, many contracts include specifications and performance targets that relate to the measures identified in the National Road Safety Plan. Transit New Zealand conducts annual reviews of the State Highway Safety Management Systemmanual, hires independent auditors to conduct random audits every year and a full audit every three years of compliance with the safety management system, and annually certifies the state highway network on its safety performance.
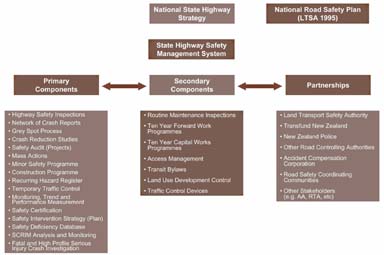
Figure 26. Safety management system's impact on planning and decision-making.
Agency strategies are used in particular for integrating safety concerns into both ongoing maintenance activities and new construction. The key safety strategies are safety inspections (both day and night), crash databases by highway location, "gray spot" analysis (locations with three crashes) , crash reduction studies(conducted where gray spot analysis/ treatment has not reduced crashes), road safety audits of new and existing networks, and a strong focus on maintenance of wet road skid resistance.
Congestion
There was a growing sense in the late 1990s that roads in Auckland and Wellington were becoming severely congested. Although Transit New Zealand had conducted travel time surveys over many years, this data collection had not occurred in the context of a clearly defined congestion performance indicator. In 2002, Transit New Zealand and the Regional Councils in Auckland and Wellington introduced a data collection program that would systematically feed into an annually measured congestion indicator. The Austroads definition of this indicator—actual travel time minus speed travel time divided by distance traveled—and Austroads' floating car methodology are used in this performance-monitoring effort. The road sample for Auckland included 70 percent of the freeway length, 100 percent of state highways, and 44 percent of regional arterials. In Wellington, the sample included 100 percent of the freeway, 45 percent of state highways, and 21 percent of regional arterials. The results for Wellington are shown in table 10. The results for Auckland were considered unreliable because of methodological issues that are being addressed (congestion was so bad that the floating car method could not meet its quality control standards). Note in table 10 the use of travel time variability (or in U. S. terms, reliability). Given the successful experience in Wellington, the urban congestion indicator approach is being implemented in two additional cities, Tauranga and Christchurch.
Customer Satisfaction
Transit New Zealand gives considerable attention in its performance management framework to customer satisfaction. In 1998, road users, as a generic group, were surveyed on a range of desirable and undesirable characteristics of the road network and overall level of satisfaction. In 2000, the survey focus was changed to identify satisfaction and dissatisfaction by market segment, such as commercial truck drivers and short-and long-distance travelers. In 2003, fewer, more targeted questions were incorporated into the survey to "gain a better understanding of the prioritization" of key characteristics of the road system by road users. As noted in the report summarizing the 2003 survey results, "this would lead to the overall performance ratings of Transit New Zealand being more transparent." In addition, "reasons for dissatisfaction were sought, to ensure results were actionable."
The survey was conducted on a regional basis, with a minimum of 200 surveys per region. A total sample size of 1,500 usable surveys formed the basis of the results, and conclusions were drawn only where a 95 percent confidence level could be obtained.
The survey results provided important information to Transit New Zealand. Only 22 percent of the respondents rated the state highway network as either fair or poor, while 78 percent rated it good, very good, or excellent. The survey showed a clear linkage between overall satisfaction with the state highway network and satisfaction with safety, pavement quality, and congestion. In 2000, of all user groups, the one showing the most dissatisfaction was commercial truck drivers, where dissatisfaction was most related to poor ride quality. In response, Transit New Zealand developed a truck ride indicator that measured the pitch-and-roll response of trucks to the road surface. Segments of the road network that fared poorly by this new indicator were targeted for improvement through Transit New Zealand's maintenance program. More than NZ$7 million (US$5.1 million) has been spent specifically on poor truck ride sections of highway. This so-called "truckie survey" and Transit New Zealand's proactive response to the results won national honors in the Market Research Effectiveness Award program of New Zealand's Market Research Society.
Asset Management
Transit New Zealand is a world leader in the use of asset management for guiding road investment decisions. A State Highway Asset Management Plan links the day-to-day activities of asset management with the strategic framework represented by the National State Highway Strategy and the statement of intent. The performance measures incorporated into the asset management plan are referred to as "levels of service." The definition of these levels of service is directly tied to the values associated with different customer groups. Transit New Zealand uses a variety of mechanisms to gather input on these values, including customer surveys, corridor management plans, input from targeted user groups, and input from other national agencies such as Transfund and the New Zealand Police.
The asset management plan includes an extensive list of level of service measures for all facets of the road infrastructure business. Many measures are used at the operating levels of the organization to guide maintenance decisions, while others include those identified in the statement of intent. Some level of service measures highlighted in the plan include the following:
Safety
Efficiency
Road users
Table 11 shows how the asset management plan is relevant to the key goals adopted by Transit New Zealand.
Transit New Zealand values its asset base at close to NZ$15 billion (US$11 billion) for replacement cost and NZ$12 billion (US$8.8 billion) for depreciated replacement cost. The sense of the scan team was that Transit New Zealand has a much better handle on asset valuation and asset management than most U.S. State highway agencies.
Private Delivery of Services
When Transit New Zealand was created by the Transit New Zealand Act of 1989, the legislation also required all highway maintenance and construction contracts to be competitively bid. With more than NZ$500 million (US$366 million) of maintenance and capital improvement projects each year, the requirement to bid all maintenance services competitively presented a significant challenge to Transit New Zealand. For maintenance, the agency identified three types of procurement models, and made a strategic decision to target by expenditure about one-third of all maintenance work for each model. These three models were the following:
The differences in these three types of models are shown in table 12.
Note: SPOOR is schedule of rates; ILS is lump sum.
The interest of the scan team in these different forms of service delivery relates to the linkage between organizational outcomes and strategic performance measures defined by corporate management. By using performance-based contracts, Transit New Zealand is providing a means for vertically integrating strategic corporate directions and decision-making with the day-to-day operations of the organization, and the decisions made in the field relating to ultimate outcomes.
| Observations From Transit New Zealand on Performance Measurement
|
| "Key performance indicators will be dramatically different if sustainability is the key driver for decision-making."—Transit NZ official |
Observations
Transit New Zealand and other New Zealand government agencies face a potentially important shift in the policy context of their strategic and tactical activities. The government's new policy on sustainability and the requirement that government agencies show how their actions will help achieve a sustainable New Zealand represent an organizational culture shift of great significance. Before this policy change, Transit New Zealand was a highway agency operating with environmental constraints. Now, there is encouragement to mitigate, to a wider extent, the environmental health effects of the state highway network. Transit New Zealand officials expect that the agency will have to do things differently, and that key performance indicators will have to be developed that reflect transportation's contribution to sustainability. This means Transit New Zealand will have to become more involved with actions traditionally outside its purview, such as demand management, land use management, and pricing. This policy shift will be implemented in a short time frame. Transit New Zealand engineers are already looking at environmental mitigation investments and less intrusive designs (e.g., tunnels).
Such a shift in focus, of course, does not occur easily if the organization is incapable of understanding and implementing the change. As one Transit New Zealand official noted, "A new skills set is needed.... In responding to this new policy, we could very well have an organization of the wrong type."
The scan team also found the following observations of great interest:
| << Previous | Contents | Next >> |

