U.S. Department of Transportation
Federal Highway Administration
1200 New Jersey Avenue, SE
Washington, DC 20590
202-366-4000
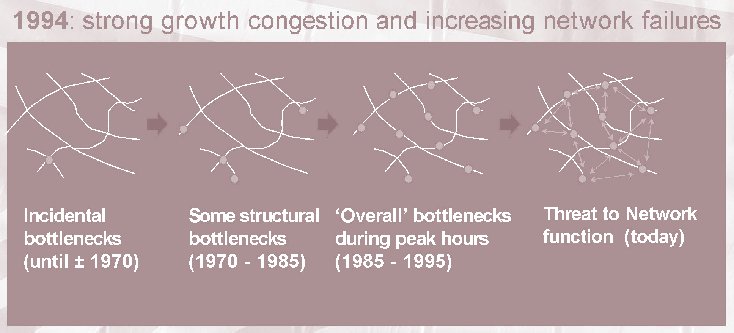
Figure 57. Illustration of congestion growth in Rotterdam, Netherlands. The title of the illustration is "1994: strong growth congestion and increasing network failures." At the far right of the illustration is a road network labeled "incidental bottlenecks (until about 1970)" with one bottleneck indicated by a dot on the network. To the right of that is a road network labeled "some structural bottlenecks (1970-1985)" with four bottlenecks indicated by dots. The next road network, labeled "overall bottlenecks during peak hours (1985-1995)," has nine bottlenecks indicated by dots. The final road network on the right side of the illustration, labeled "threat to network (today)," has nine bottlenecks linked by arrows.

