U.S. Department of Transportation
Federal Highway Administration
1200 New Jersey Avenue, SE
Washington, DC 20590
202-366-4000
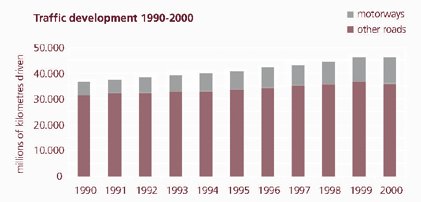
Figure 25. Bar chart of traffic growth in 1990s in Denmark. Years from 1990 to 2000 are on the x axis and millions of kilometers driven is on the y axis. Each bar has two sections: motorways and other roads. In 1990, millions of kilometers driven equaled 31,000 on other roads and 5,000 on motorways. In 1991, the total was 32,000 on other roads and 5,000 on motorways. In 1992, the total was 33,000 on other roads and 6,000 on motorways. In 1993, the total was 33,000 on other roads and nearly 7,000 on motorways. In 1994, the total was 33,000 on other roads and 7,000 on motorways. In 1995, the total was 34,000 on other roads and more than 7,000 on motorways. In 1996, the total was 35,000 on other roads and 8,000 on motorways. In 1997, the total was 35,000 on other roads and 9,000 on motorways. In 1998, the total was 36,000 on other roads and 9,000 on motorways. In 1999, the total was more than 36,000 on other roads and nearly 10,000 on motorways. In 2000, the total was 36,000 on other roads and 10,000 on motorways.

