U.S. Department of Transportation
Federal Highway Administration
1200 New Jersey Avenue, SE
Washington, DC 20590
202-366-4000
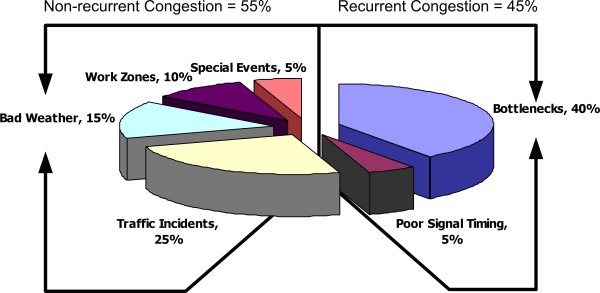
Figure 1. Pie chart of causes of traffic congestion in the United States. Nonrecurrent congestion totals 55 percent, including traffic incidents, 25 percent; bad weather, 15 percent; work zones, 10 percent; and special events, 5 percent. Recurrent congestion totals 45 percent, including bottlenecks, 40 percent, and poor signal timing, 5 percent.

