U.S. Department of Transportation
Federal Highway Administration
1200 New Jersey Avenue, SE
Washington, DC 20590
202-366-4000
SNRA, local transportation agencies, and police collaborate on reviewing accident statistics to identify problems at, study, and develop solutions for high-accident locations.
In Germany, high-crash locations are identified by traffic safety commissions (known as the KEBU in Frankfurt), which typically use the frequency and type of accidents at an intersection to identify a high-crash location, or "black spot." Threshold values for the number of crashes of a similar type must be met before a location can be considered a high-crash site. In Frankfurt, an intersection with five or more accidents of the same type in one year is considered a black spot and must be addressed by the traffic safety commission. Frankfurt does not consider exposure (accident rates) in black spot identification, but some cities in Germany are beginning to rely on accident rates to help identify black spots.
The federal government provides funds for training opportunities and design/ countermeasure guidelines for traffic safety commissions. Site-specific safety solutions and countermeasures are developed on the basis of site-specific engineering studies. Traffic safety commissions are responsible for monitoring and ensuring the effectiveness of safety improvements.
Safety goals in the Netherlands are established at a national level and driven by the principles of sustainable safety. The national government covers 50 percent of the cost of safety efforts at provincial, metropolitan, and local levels.
Development of sustainable safety goals and principles has led the Dutch to adopt a systematic approach to roadway safety. The three primary principles of sustainable safety are functional use, homogeneous use, and predictable use. In 1997, the Dutch began implementing phase I of the sustainable safety plan— classifying their entire roadway network. The network was divided into three types: national and regional freeways, regional and district distributors, and urban and rural access roads. Once a road has been identified by type, officials make sure it meets its classification requirements. This systematic approach to making form follow function has provided safety improvements on roadways and at signalized intersections.
Specific intersection-related safety problems are identified through a review of accident records in coordination with local law enforcement agencies. In addition, the Dutch use their extensive network of loop detectors to help target potential speed-related and red-light-running safety problems. Once an accident problem is identified, an engineering study is performed to evaluate appropriate safety improvements. Guidance on specific safety strategies is provided in the suite of handbooks prepared by CROW. A wide array of traffic safety improvements is typically considered, but the primary focus is to reduce severity of accidents through the speed reduction measures identified in previous chapters.
As in other countries the team visited, responsibility for identifying black spots in the United Kingdom lies primarily with local highway authorities working in conjunction with police agencies. TRL developed software to help identify black spots and overall trends in highway safety. The microprocessor accident analysis package (MAAP) is built on a relational database that can be customized for a user's particular needs. The tool includes geographic information system (GIS) software to help target high-accident locations and provides the user with a range of tools for identifying and analyzing problems and isolating common features among accidents (Figure 6-1). One program feature the team found particularly useful is the stick diagram, a tabular diagram that provides a graphical summary of accident statistics at a given location (Figure 6-2).19 The diagram lists all significant characteristics of each crash (night-day, wet-dry, hour of crash, etc.), allowing analysts to identify crash-causing trends easily.
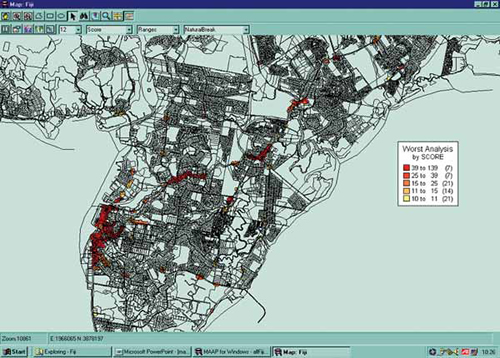
Figure 6-1. MAAP GIS-based software to target high-accident locations.
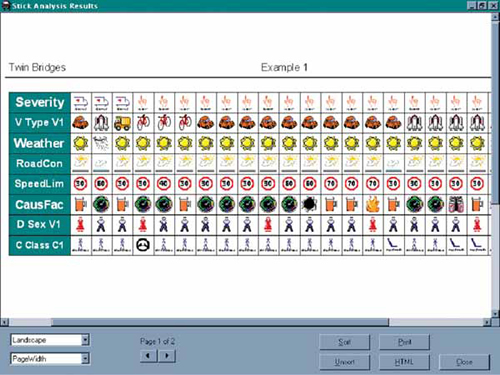
Figure 6-2. MAAP stick diagram used to graphically summarize accident statistics.
TRL has developed a software package that can be used to evaluate safety tradeoffs in the design and operation of signalized intersections. The software can be applied to new designs and used to evaluate current conditions and proposed improvements. Optimized signal capacity and delay (OSCADY) software is used primarily for capacity calculations, queue lengths, and delay at isolated signalized intersections. In addition, the software has accident-prediction capabilities for low-speed (30 miles per hour or less) urban intersections. The data required for accident prediction is vehicle and pedestrian flow, length of pedestrian crossing, geometric characteristics, and signal timing plan. With this information, the software will estimate expected accident characteristics. The software's model relies on the large amounts of empirical accident data collected in the United Kingdom, so it is not likely to produce reliable results for conditions in the United States.

