U.S. Department of Transportation
Federal Highway Administration
1200 New Jersey Avenue, SE
Washington, DC 20590
202-366-4000

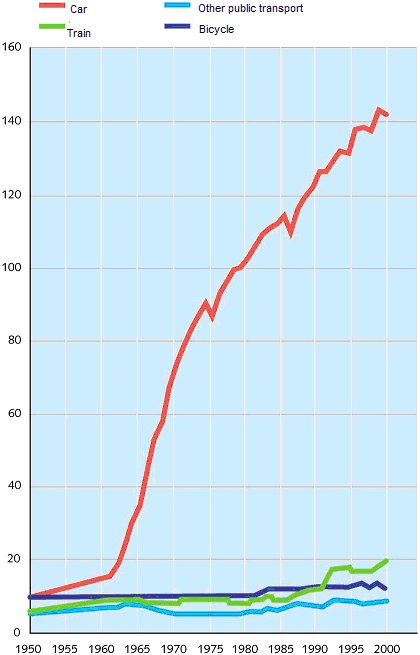
Figure 28. Graph of 50 years of traffic growth by mode in the Netherlands. Years from 1950 to 2000 are on the x axis and percentage of growth is on the y axis. Between 1950 and 2000, car traffic growth has increased more than 130 percent, while train traffic has increased 8 percent, bicycle traffic has increase about 2 percent, and other public transport traffic has increased by about 1 percent.